Design leadership & product strategy, SoftServe · Energy · Nov 2022–Jul 2024

Duke Energy

In 2022, Duke Energy’s Emerging Technology Office (ETO) had 50+ emerging-technology projects and evaluations underway, including a 195 kilowatt (kW) nickel-hydrogen battery and a 150 kW solar field to EV fleet charging and a 1.5-mile overhead and underground test feeder.

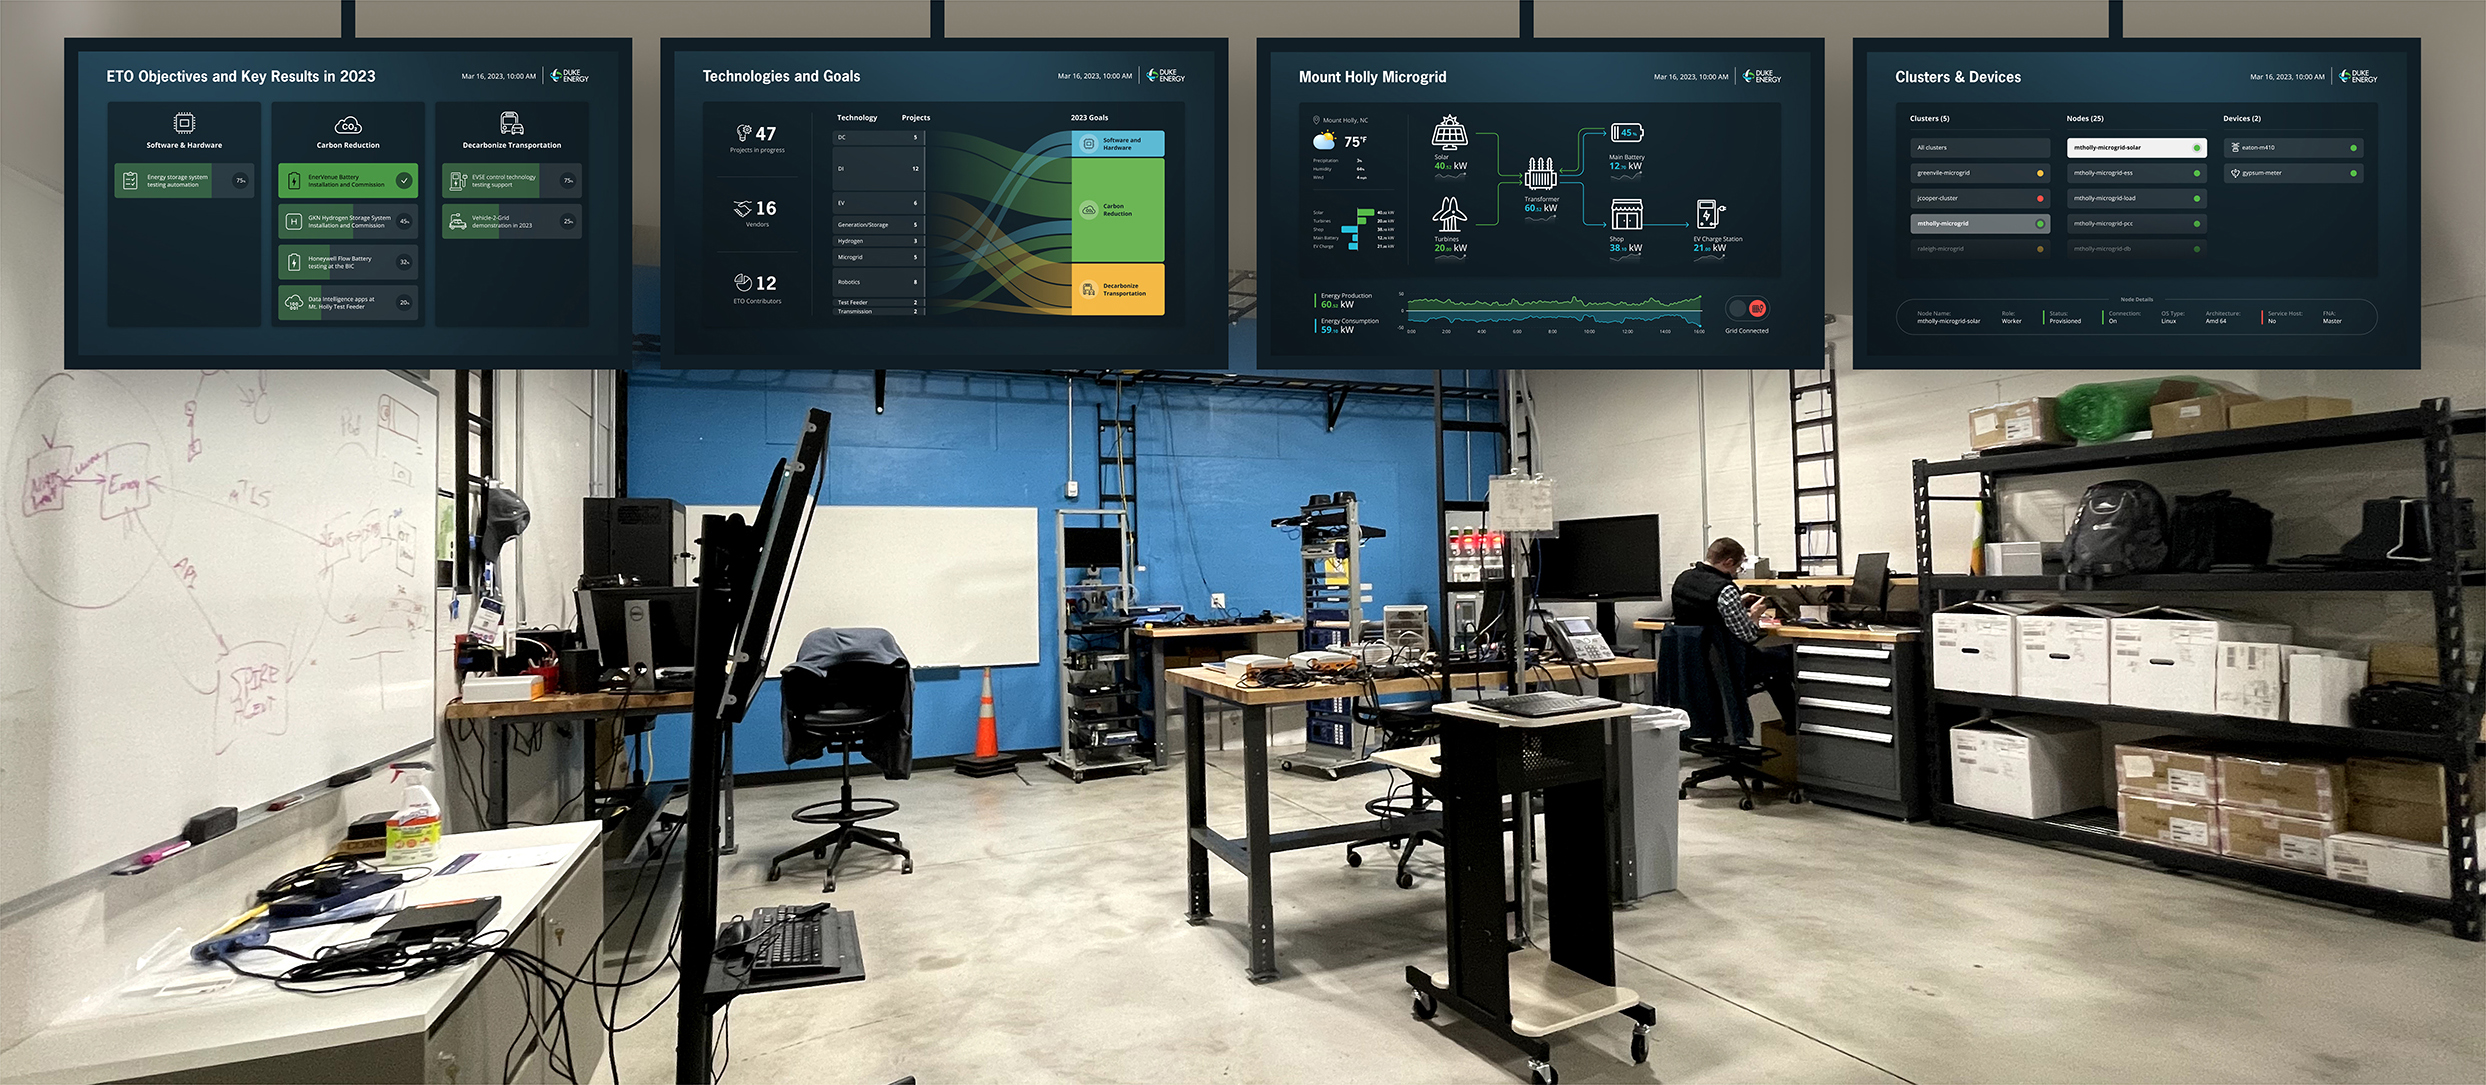
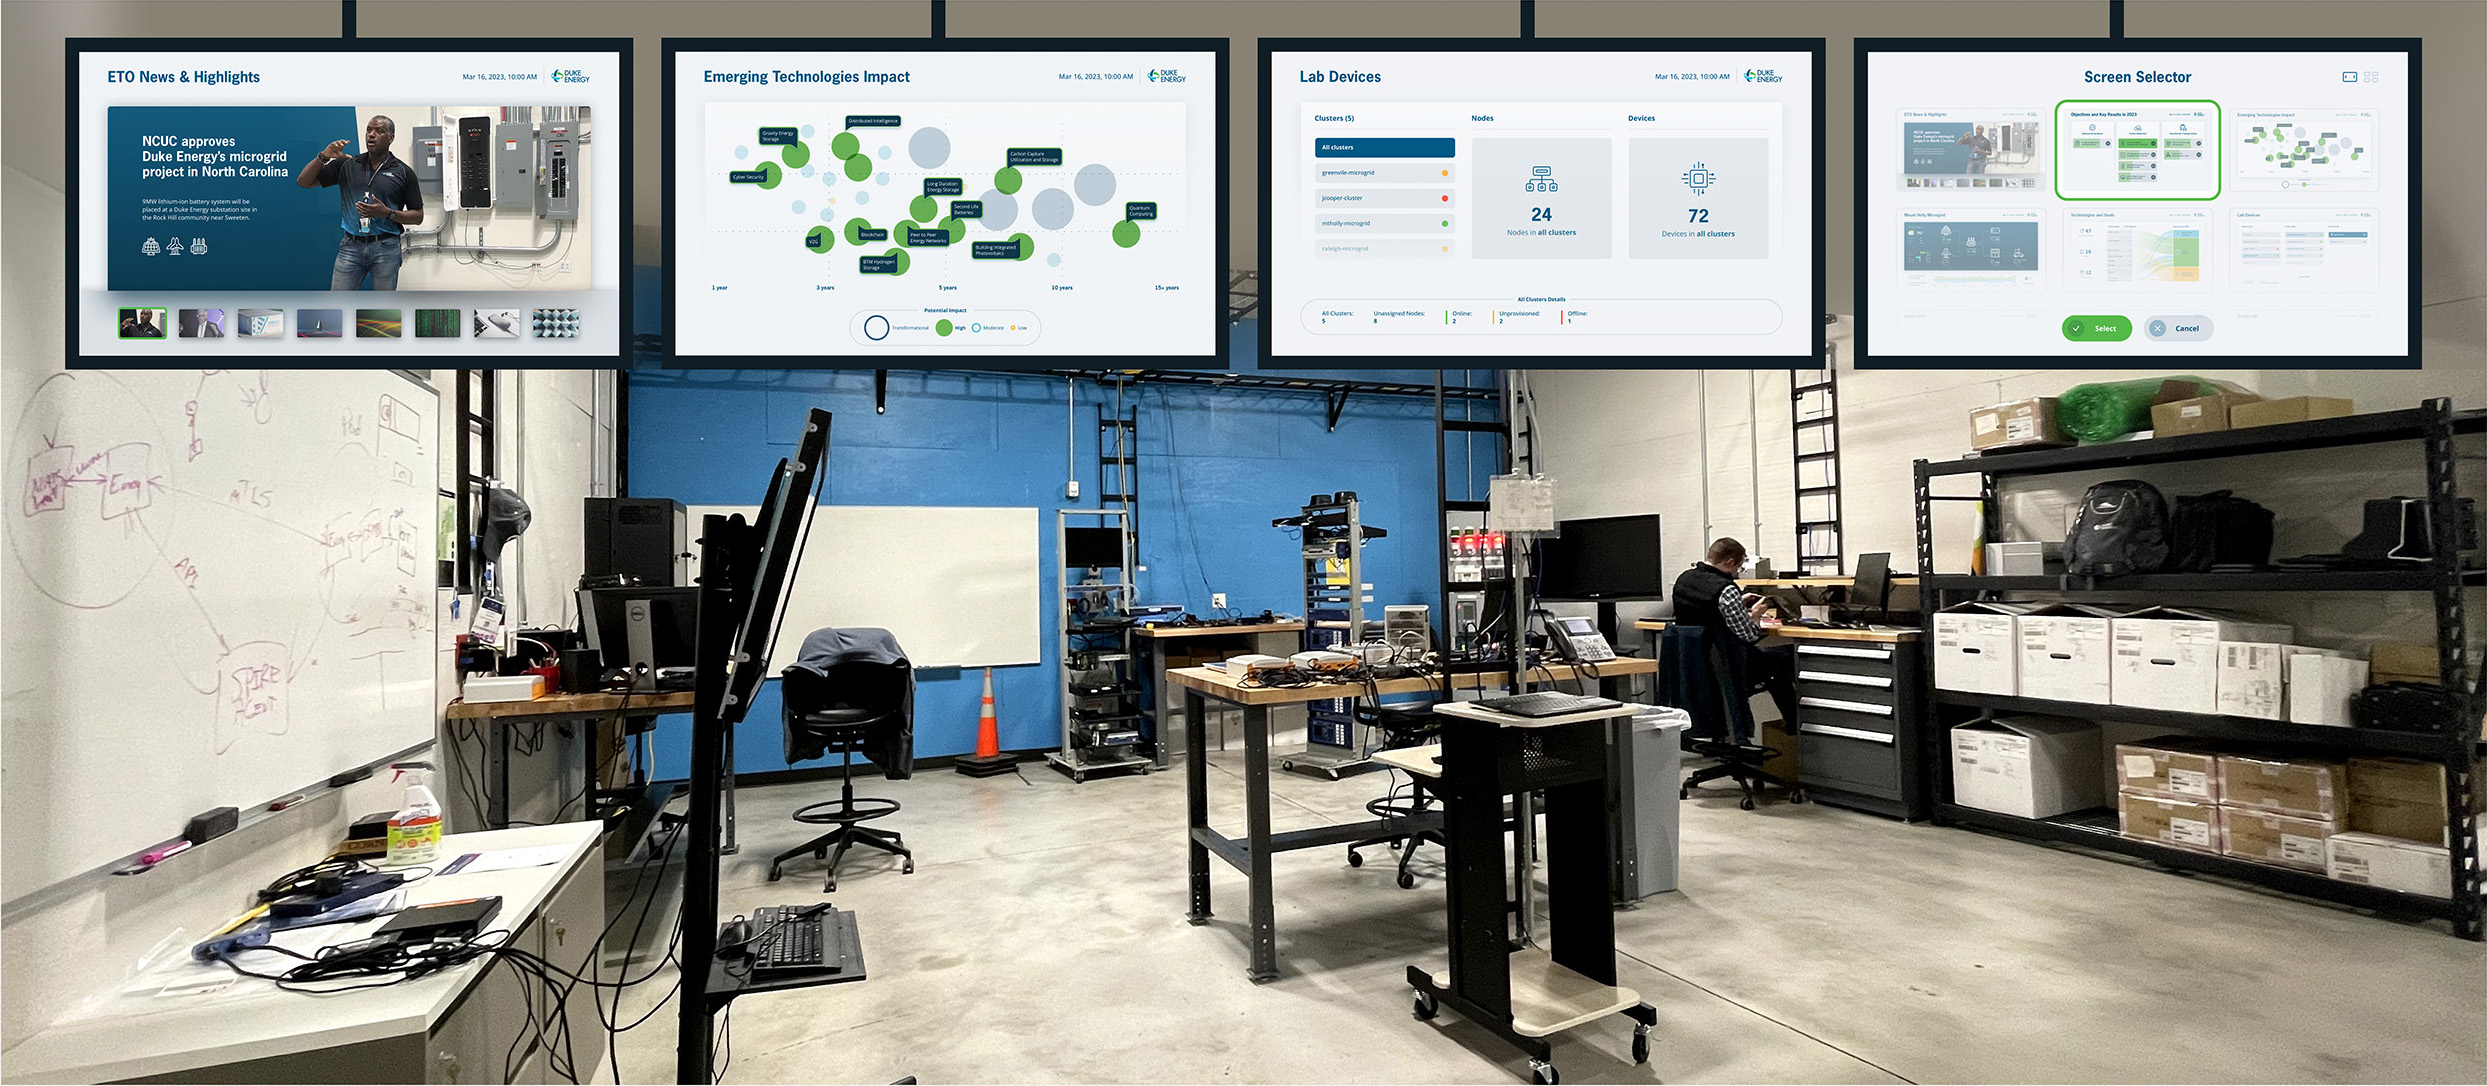
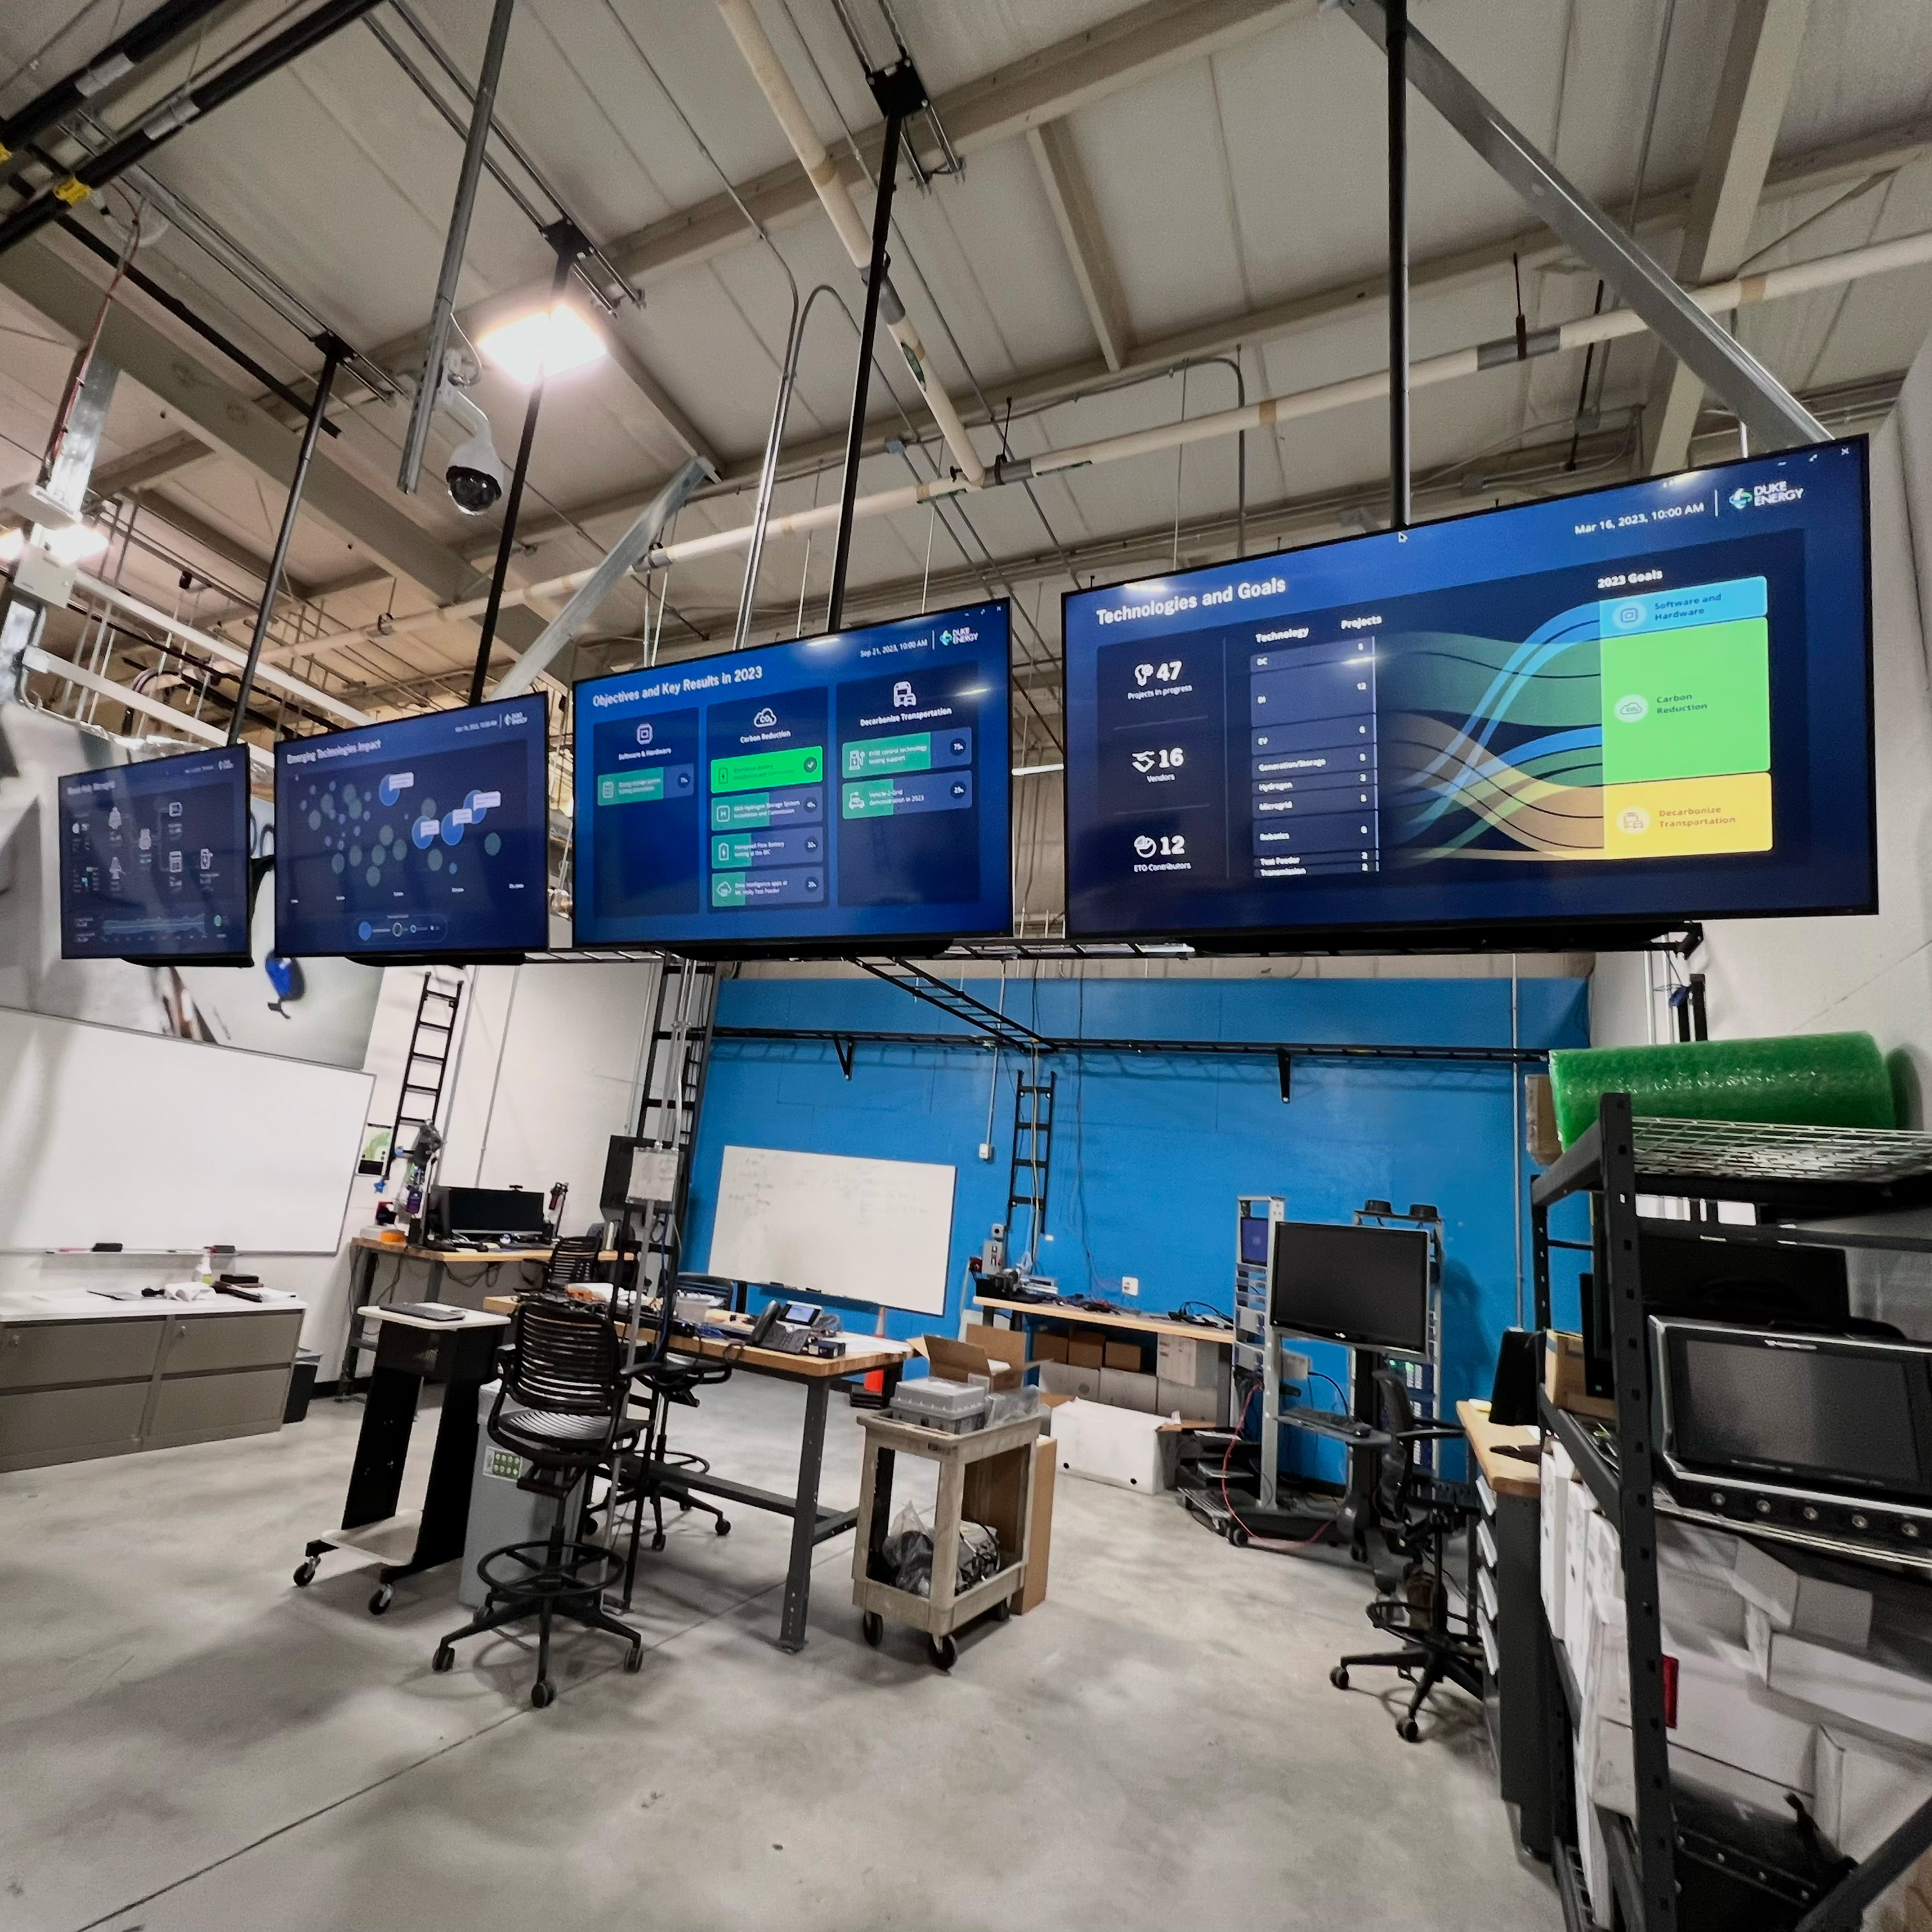
The work started with four large monitors in Bay 3 at ETO’s Mount Holly facility: How could they keep the team current? And could leadership use the same information too?

Over roughly 18 months, I led product and design strategy across portfolio visibility, reporting workflows, and, ultimately, an ETO Control Center (ETOCC). I set the research plan, facilitated nearly every workshop, and led synthesis and concept development.
By Skipper Chong Warson · Published 23 Sep 2025 · Updated 7 Sep 2026

Program initiative dashboard concepts for Duke Energy's Emerging Technology Office

It all started with four monitors

When we arrived, the monitors had just been installed and ETO was already using them opportunistically—to explain technical systems and projects and to support tours. At the same time, project information lived across Asana, presentations, reporting systems, files, and the people doing the work.

So the question quickly became larger: What information should always be visible to make the work easier?

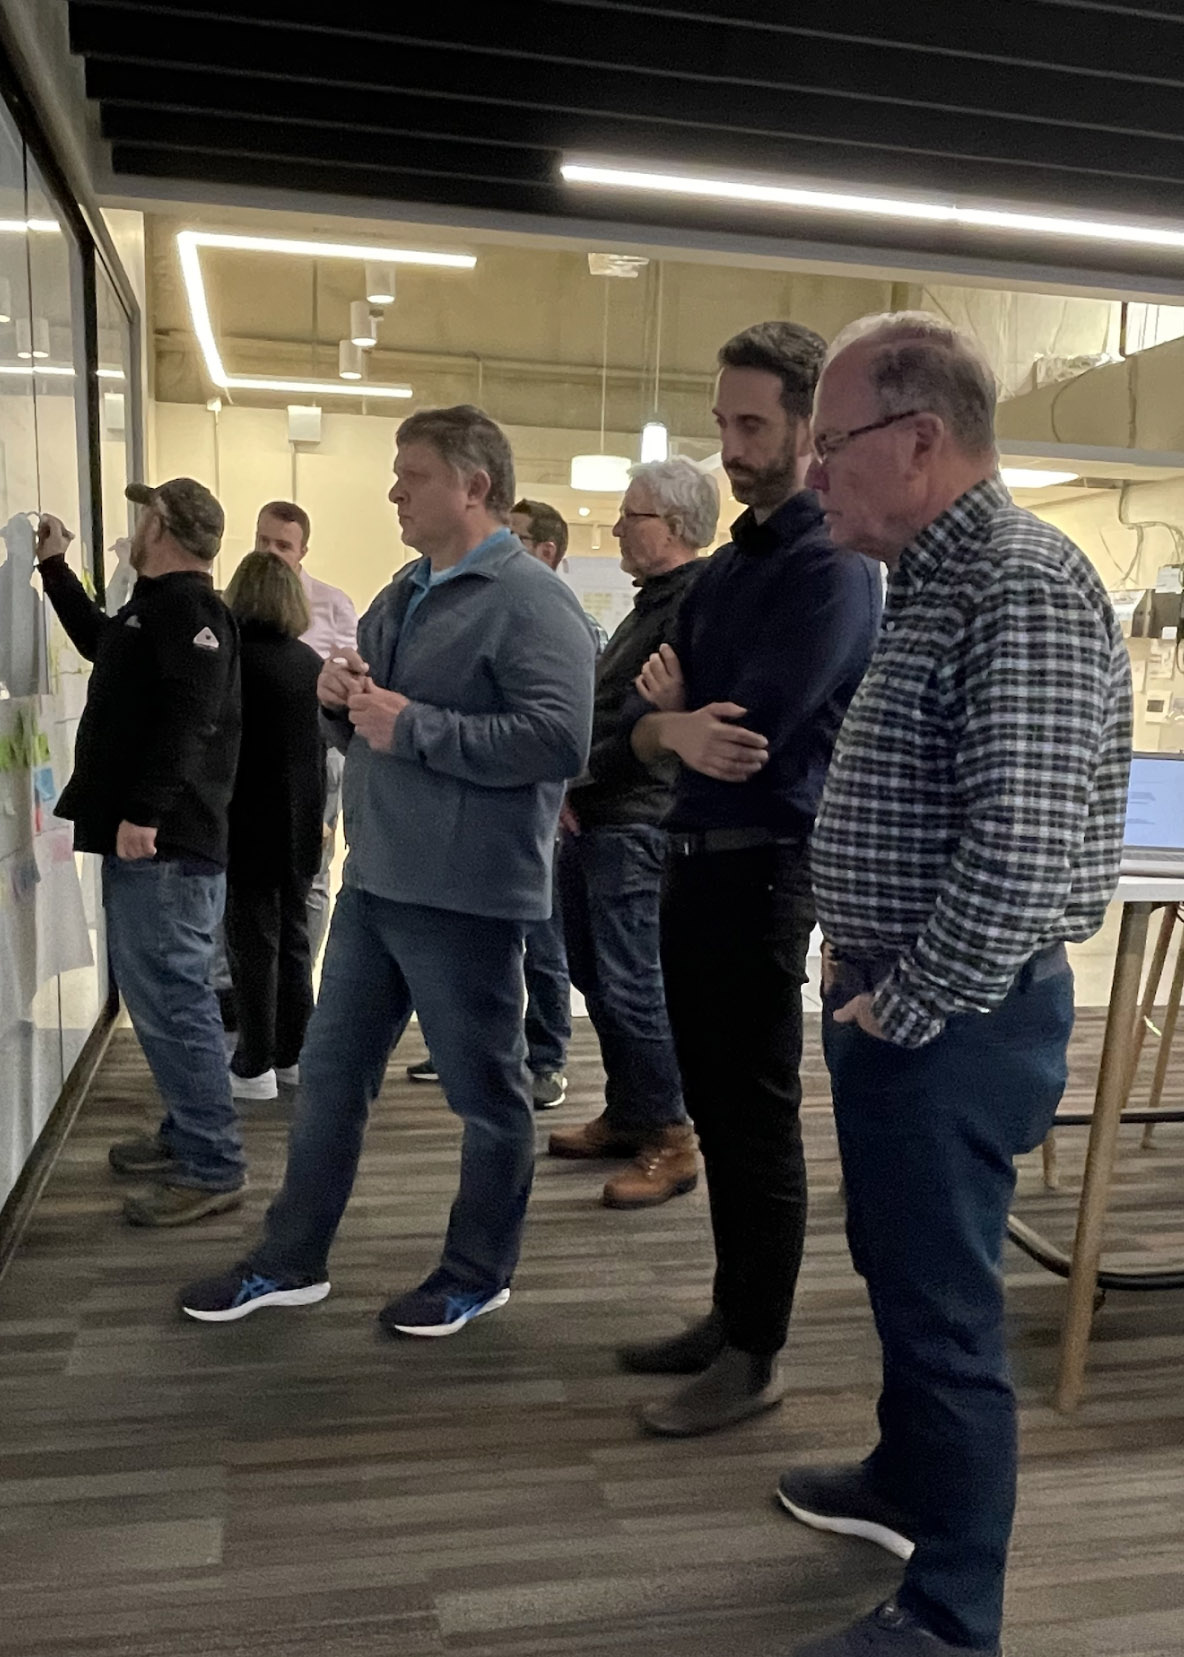
We used interviews, observation, surveys, and three rounds of workshops to understand how information moved between technical staff, leadership, visitors, and other Duke teams.

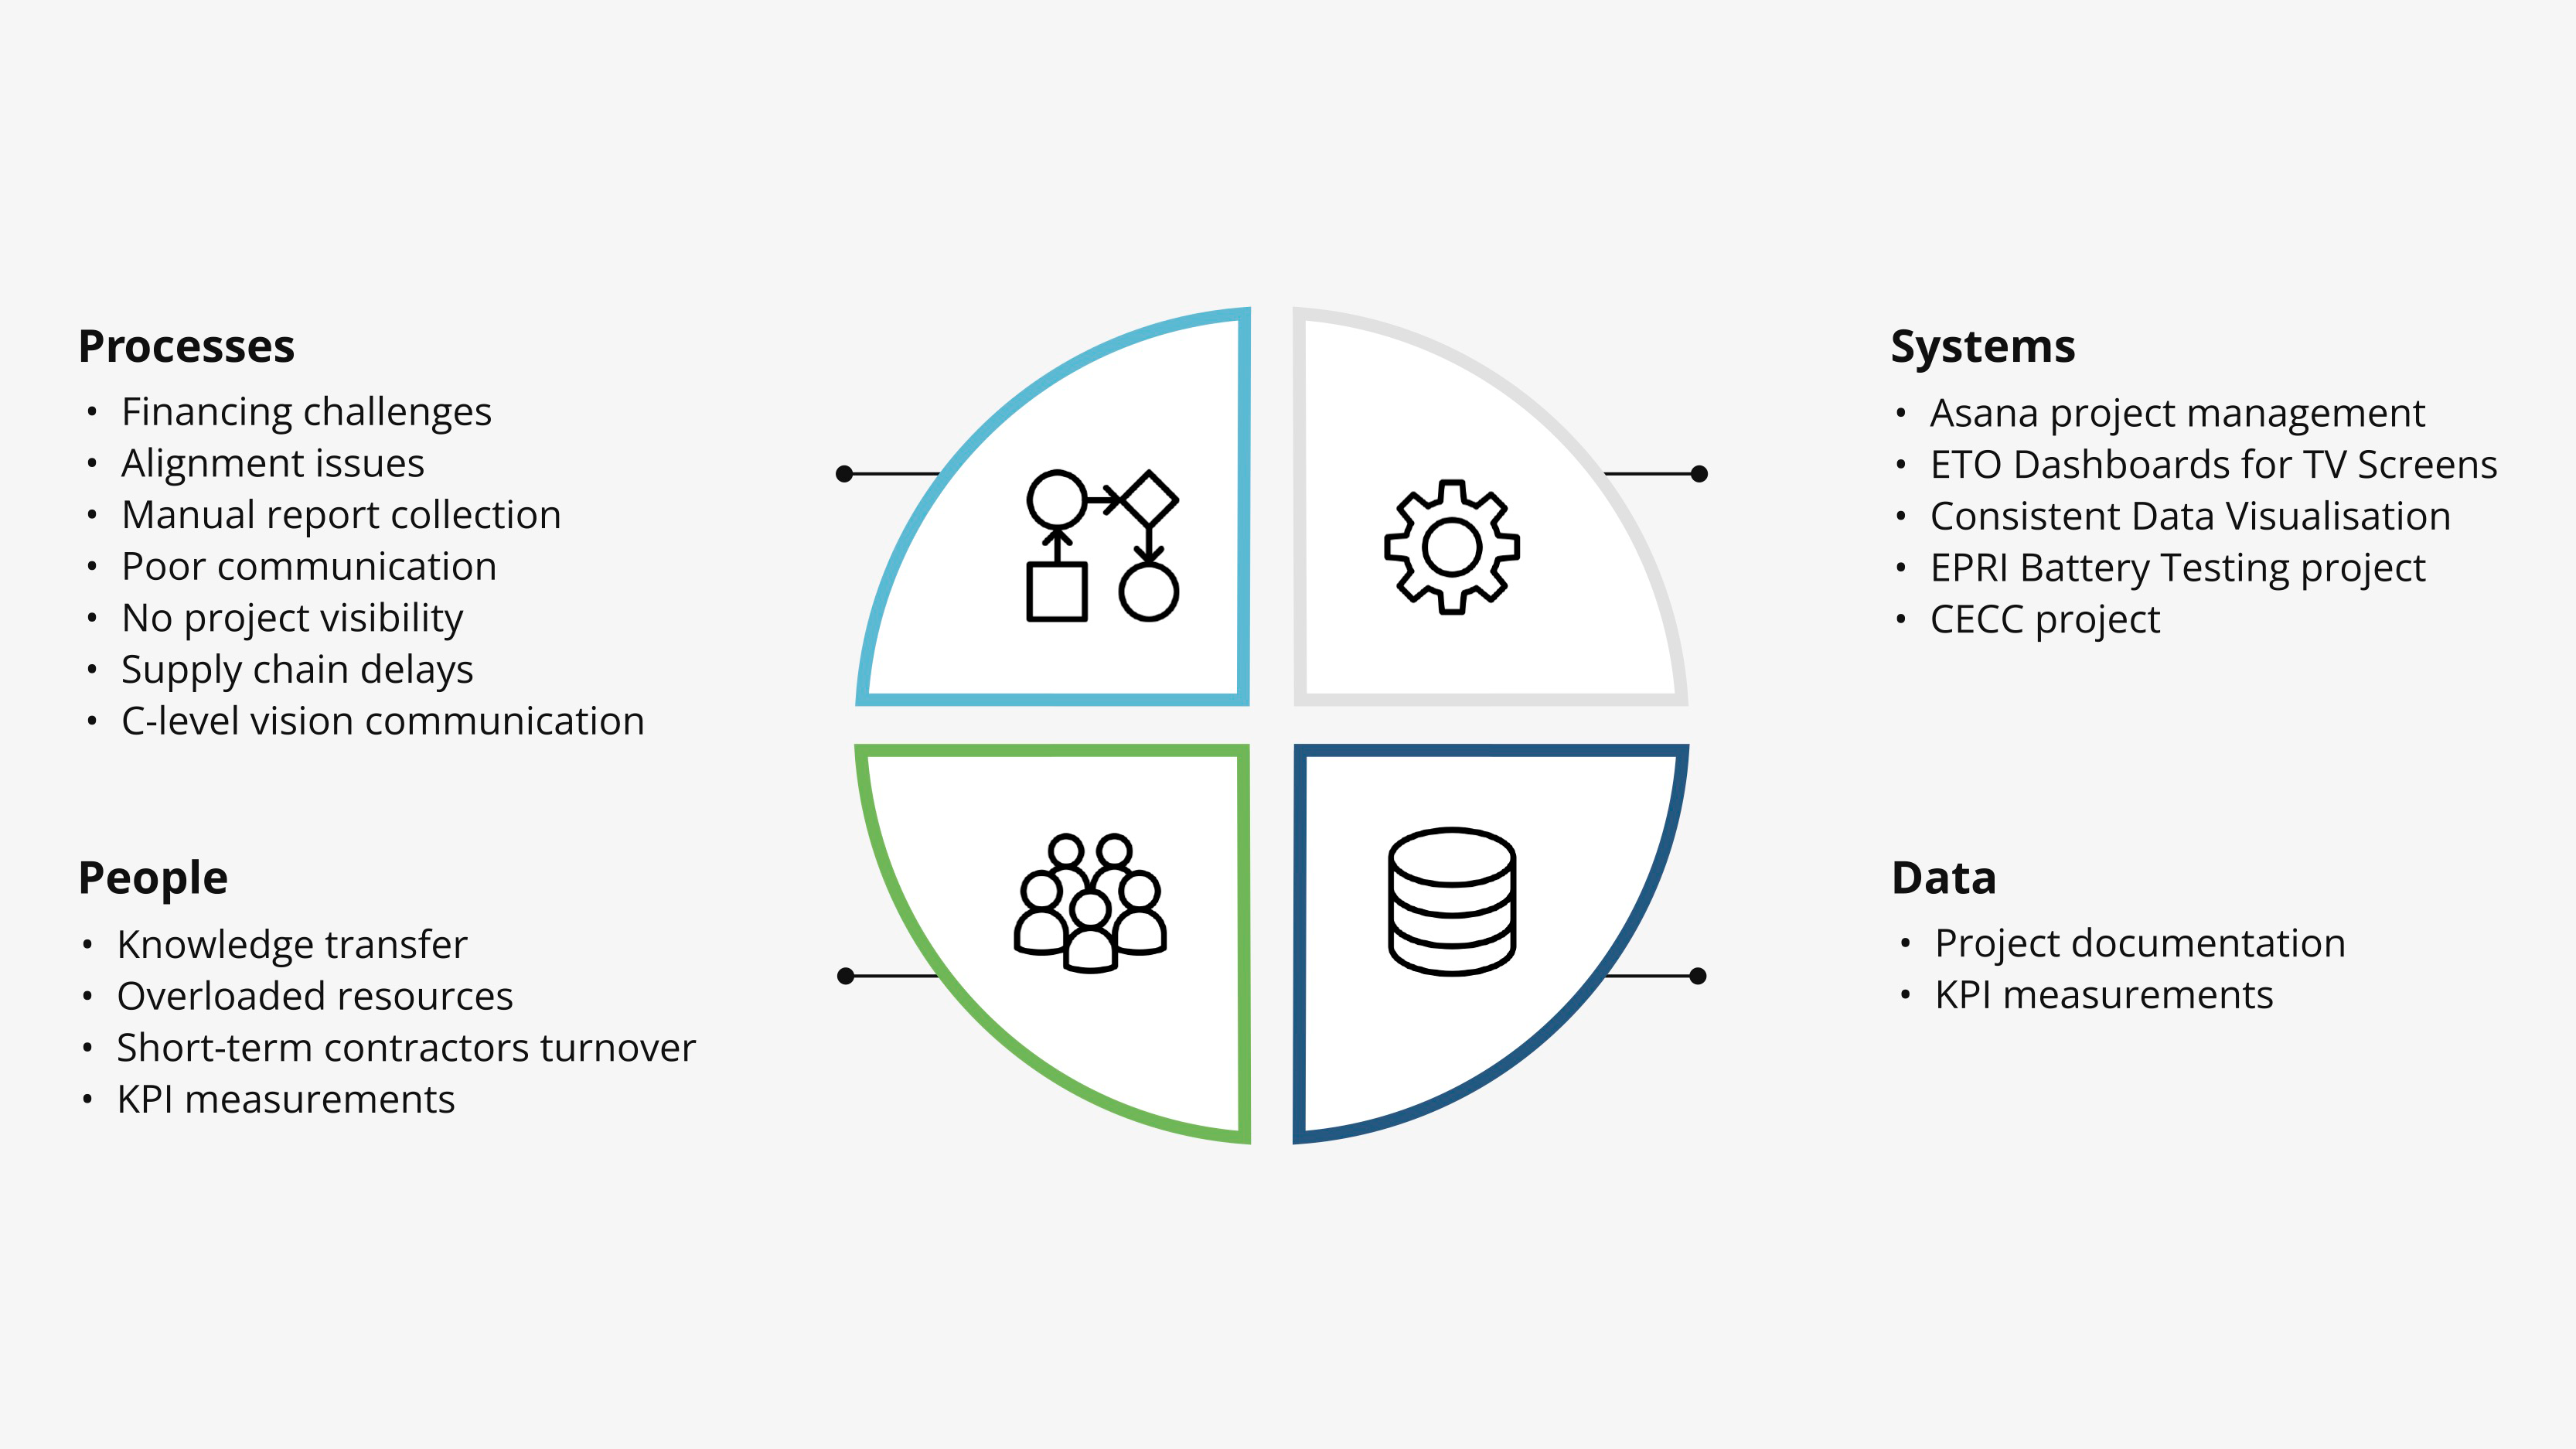
Research framing of ETO challenges across processes, systems, people, and data

The screen question exposed an operating problem. Research surfaced connected issues across people, processes, systems, and data: manual reporting, uneven project visibility, overloaded staff, disconnected information, and inconsistent documentation.

Make the work visible

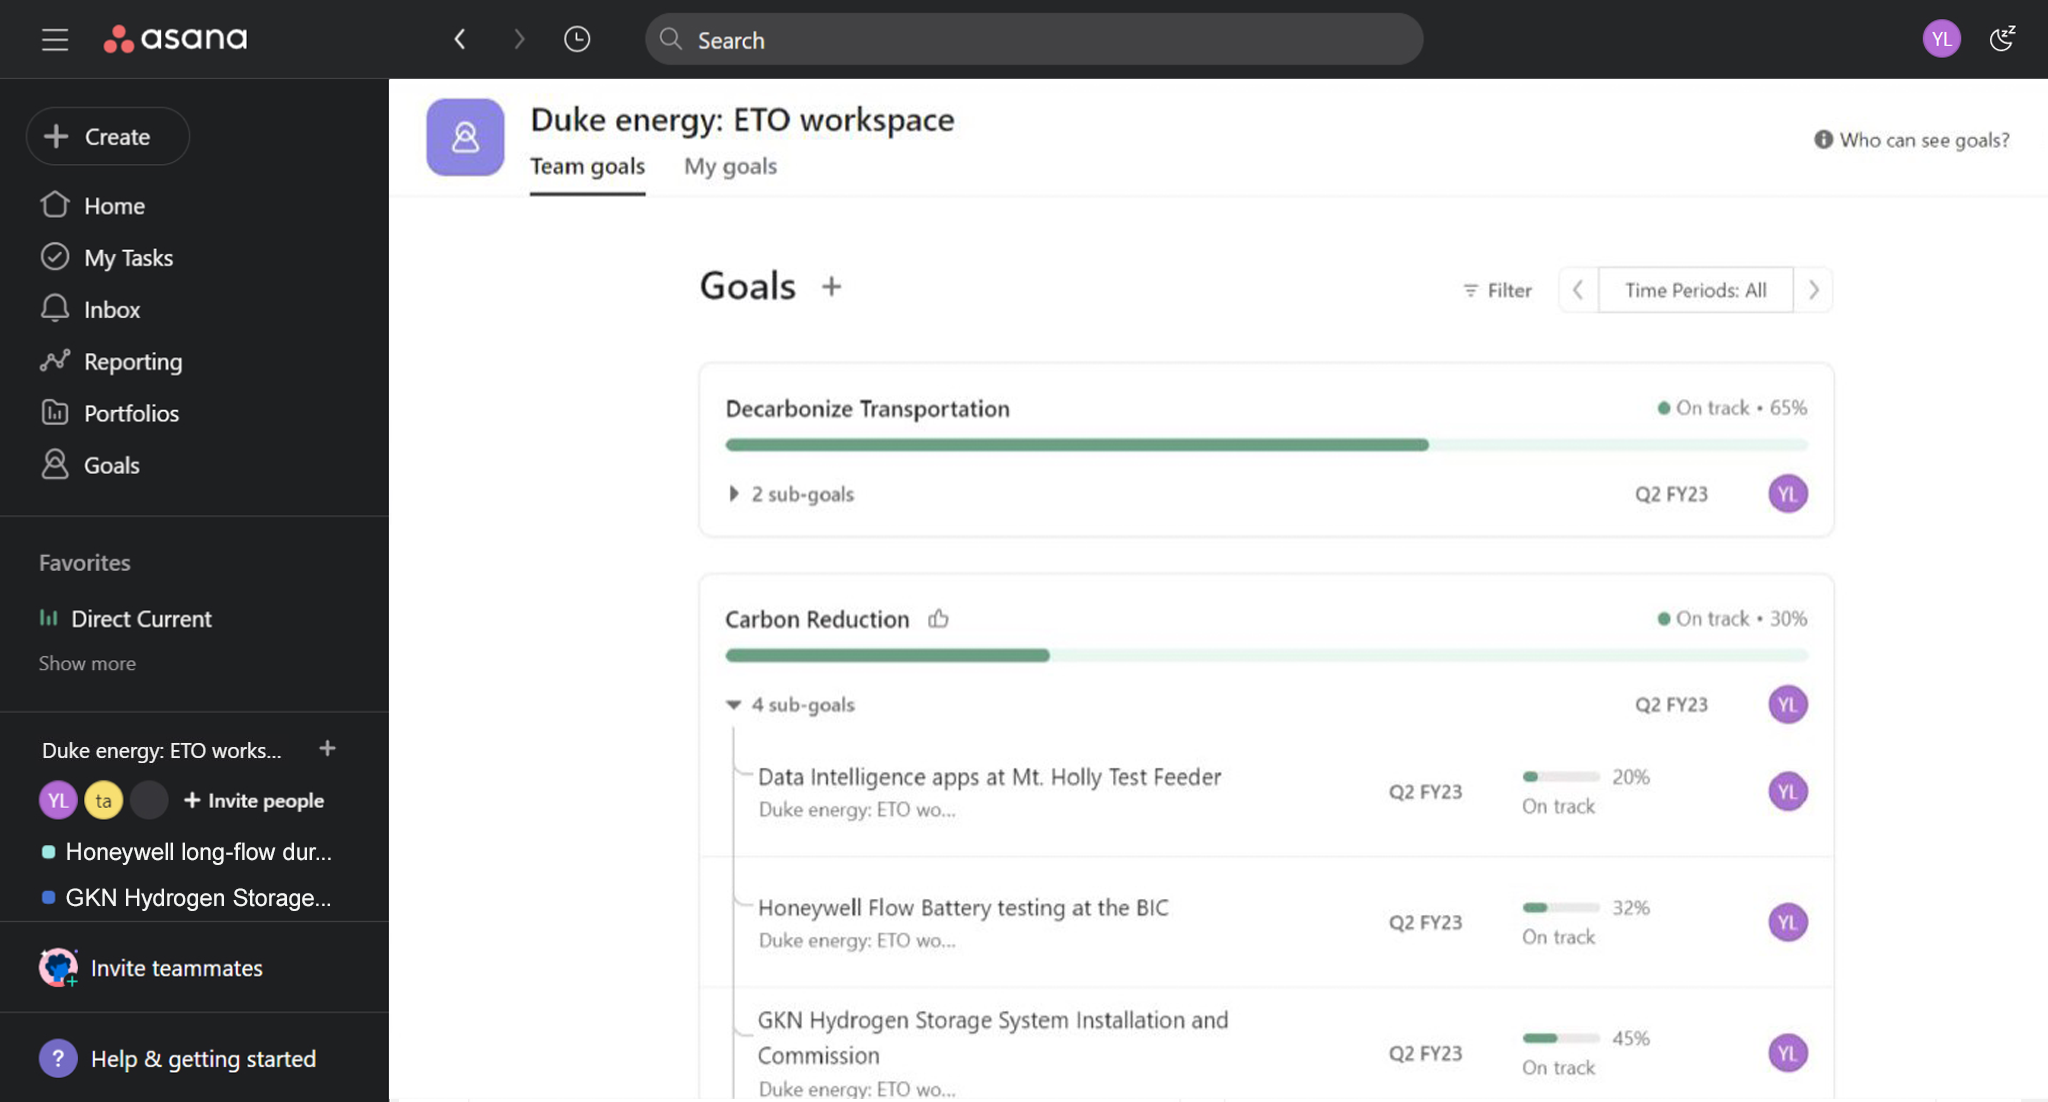
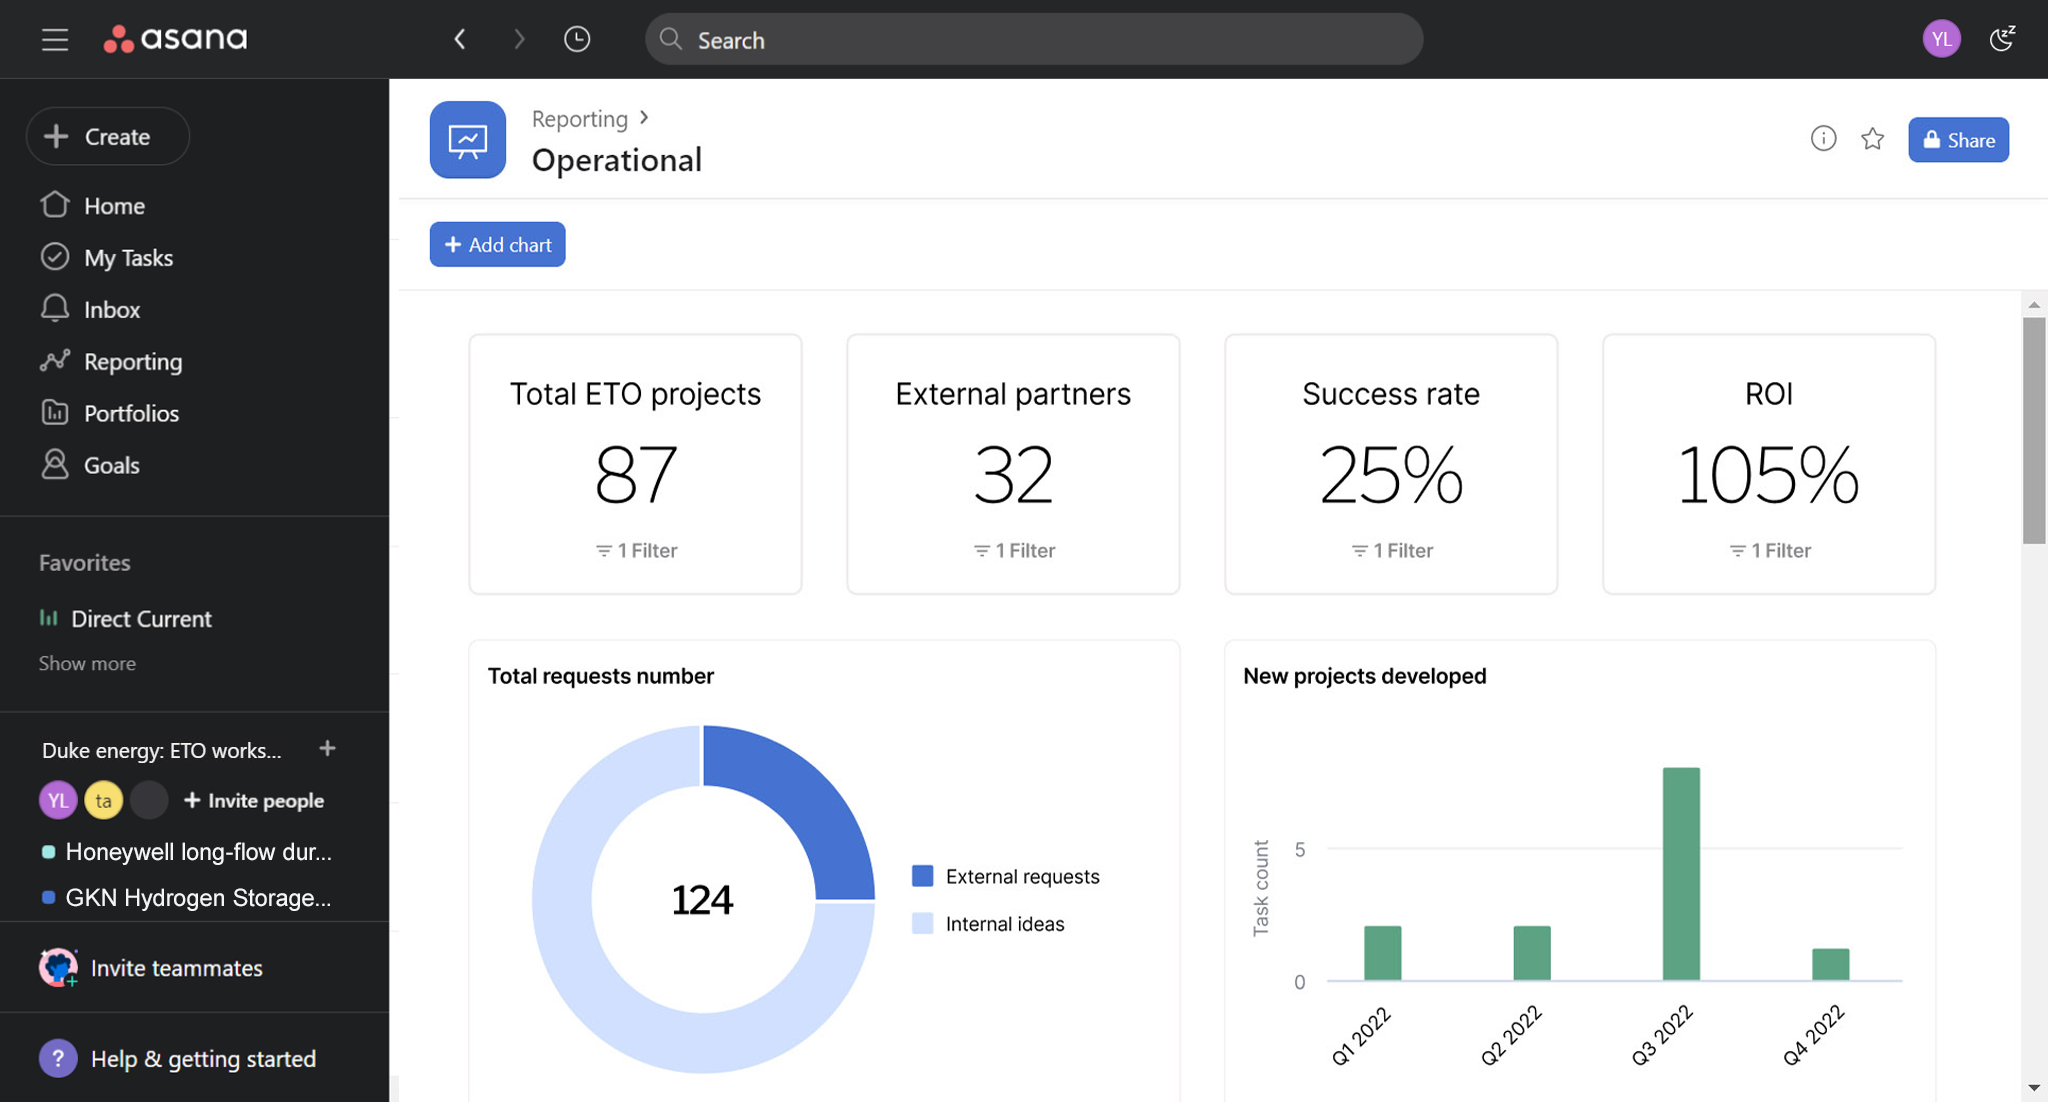
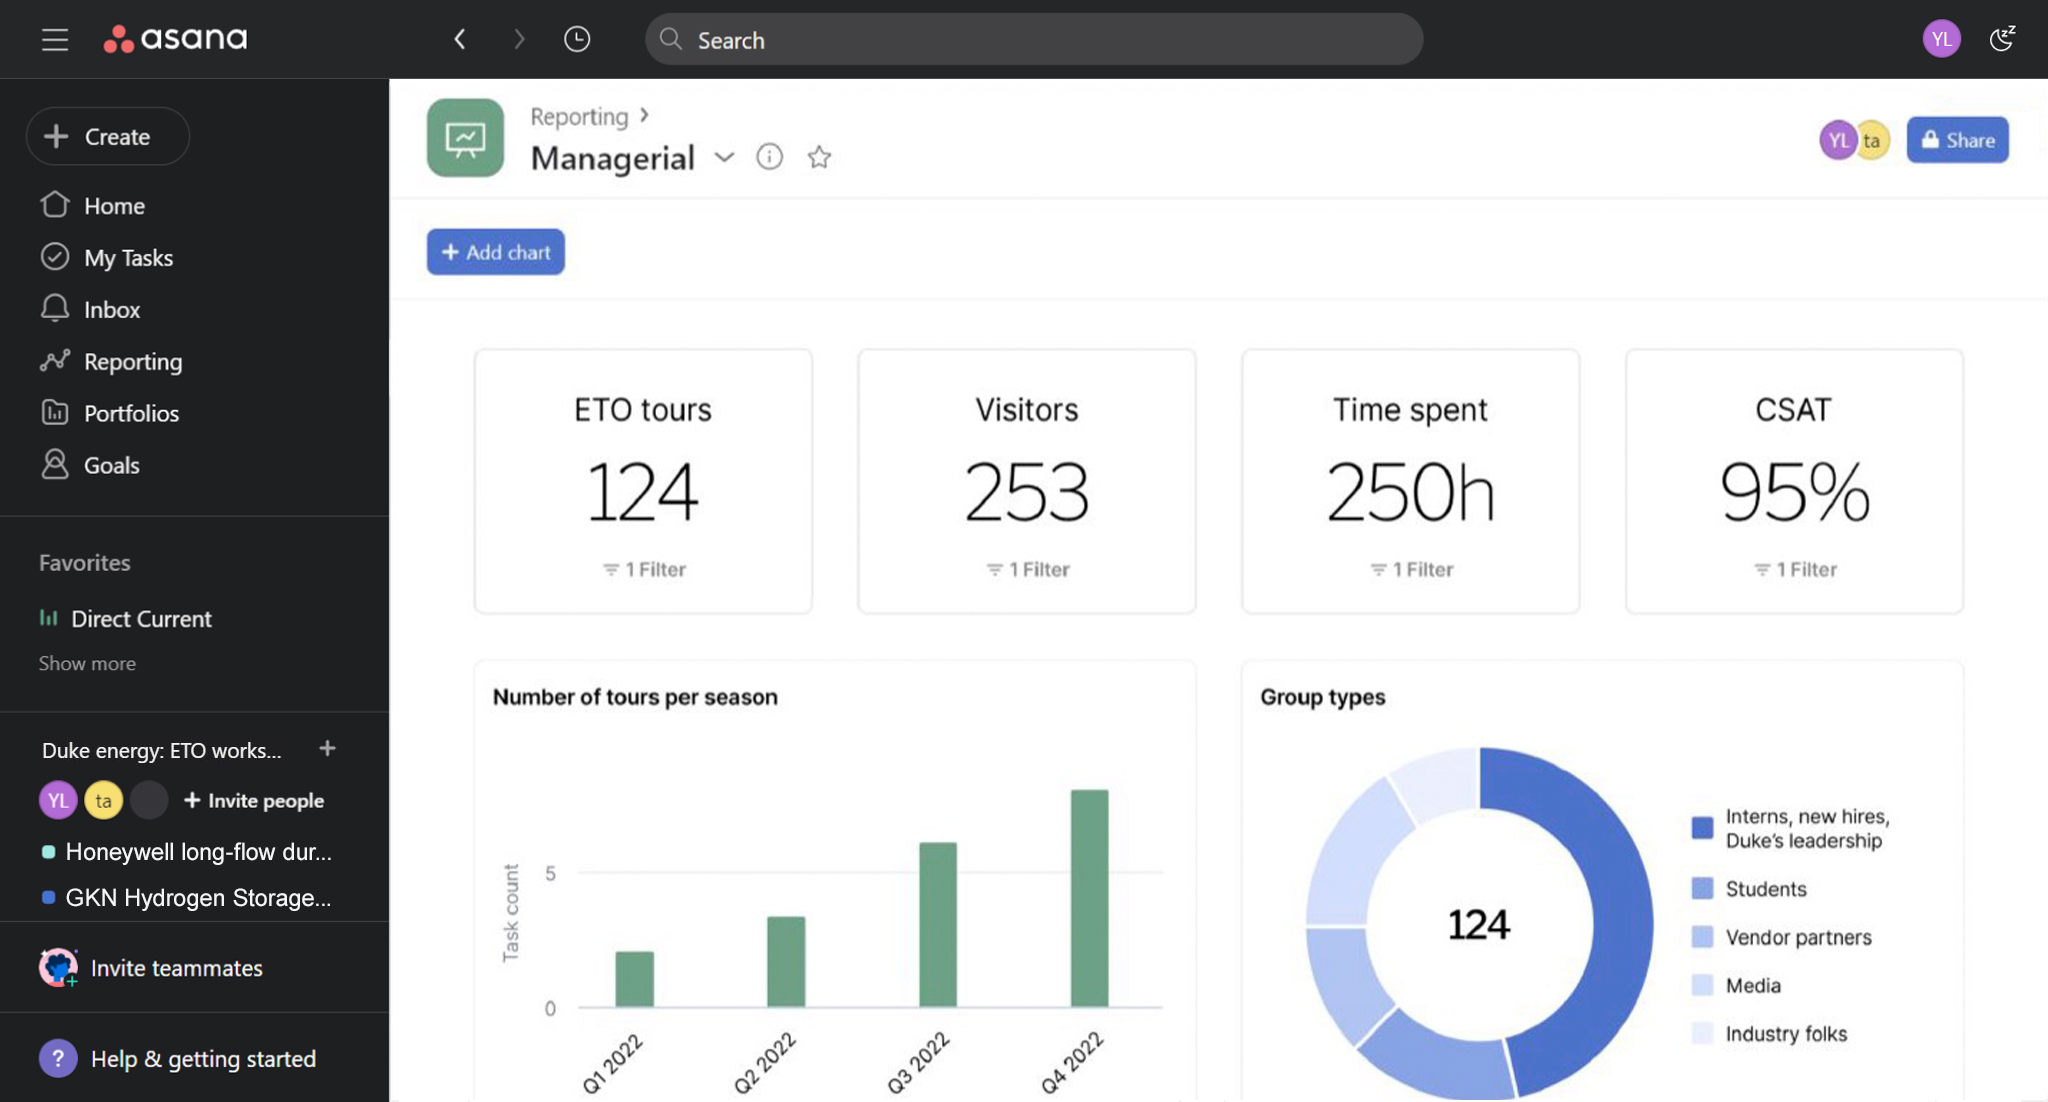
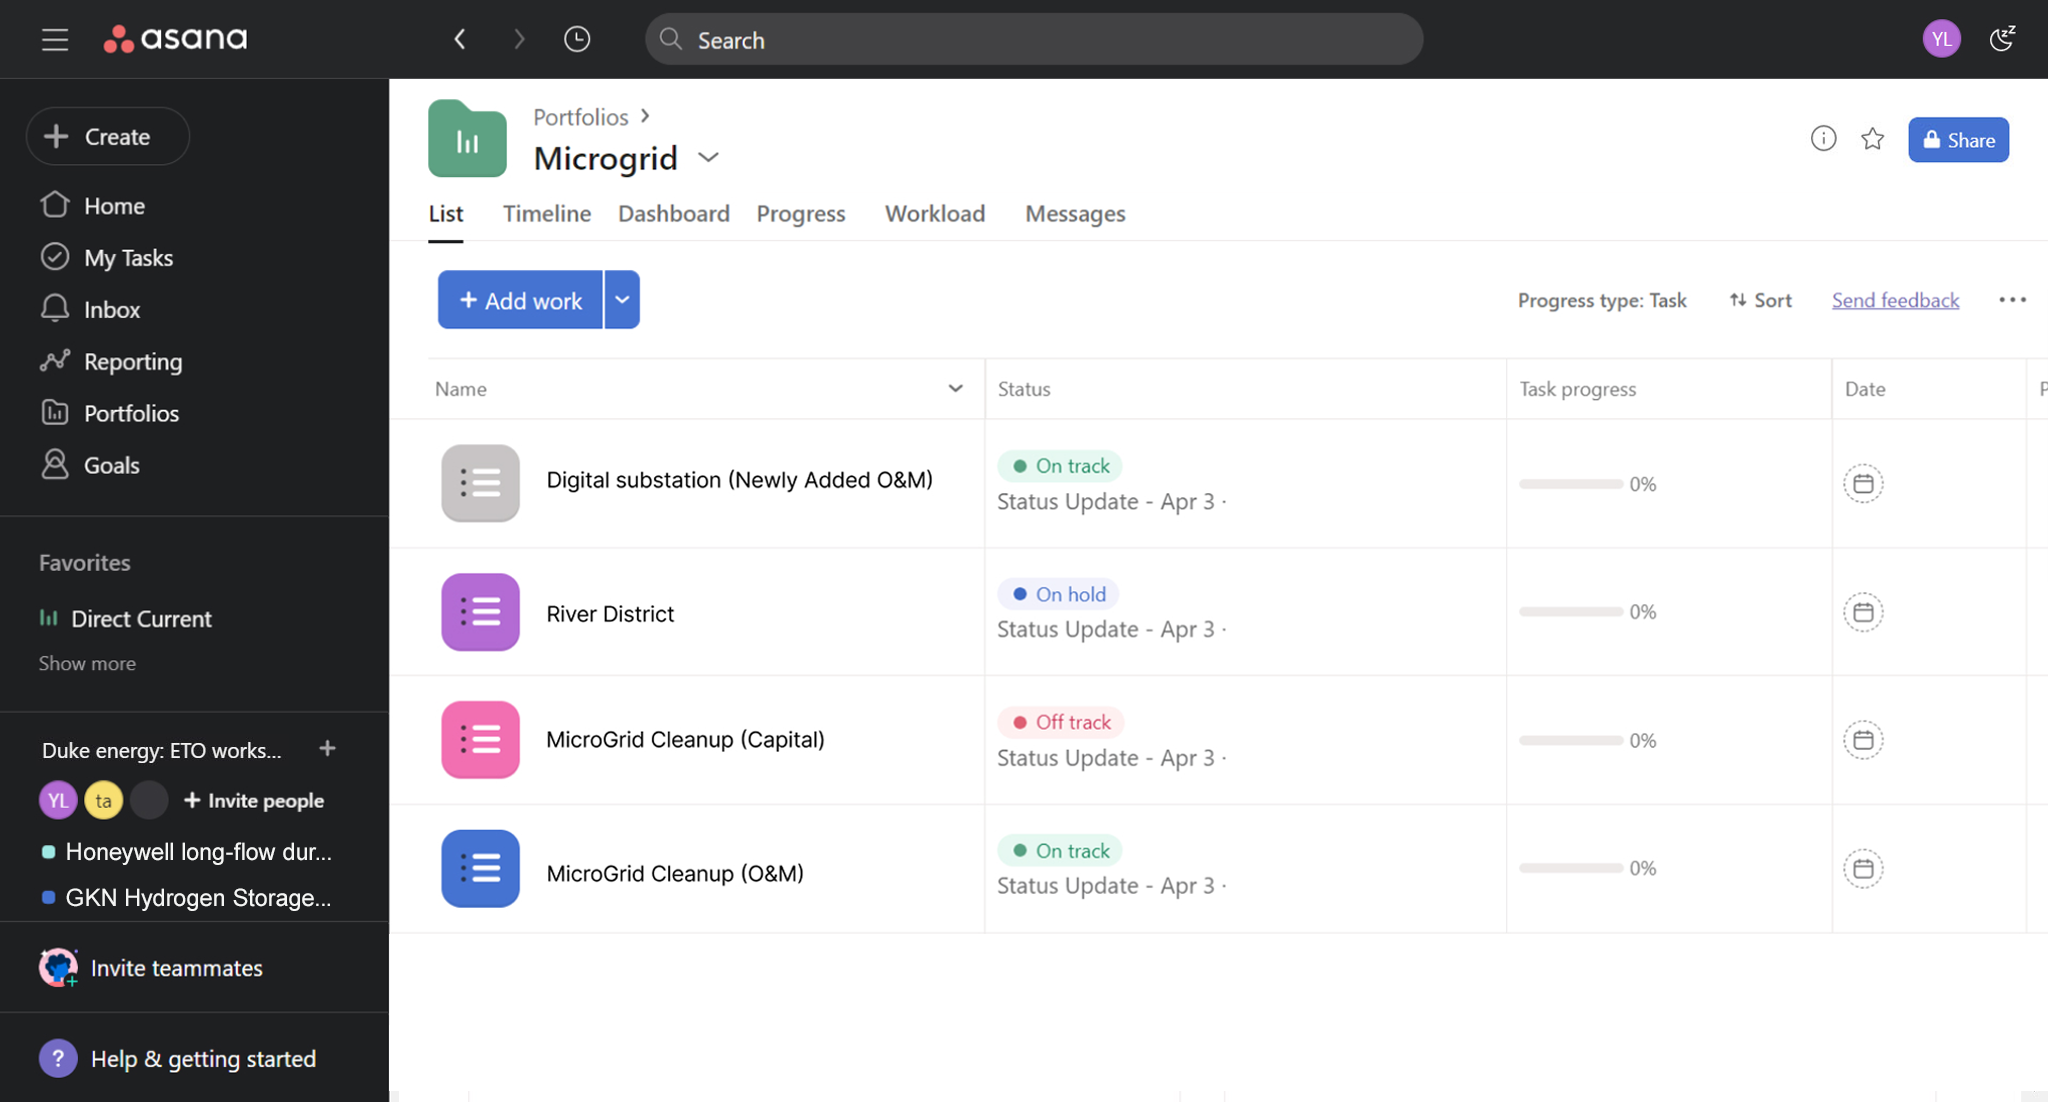
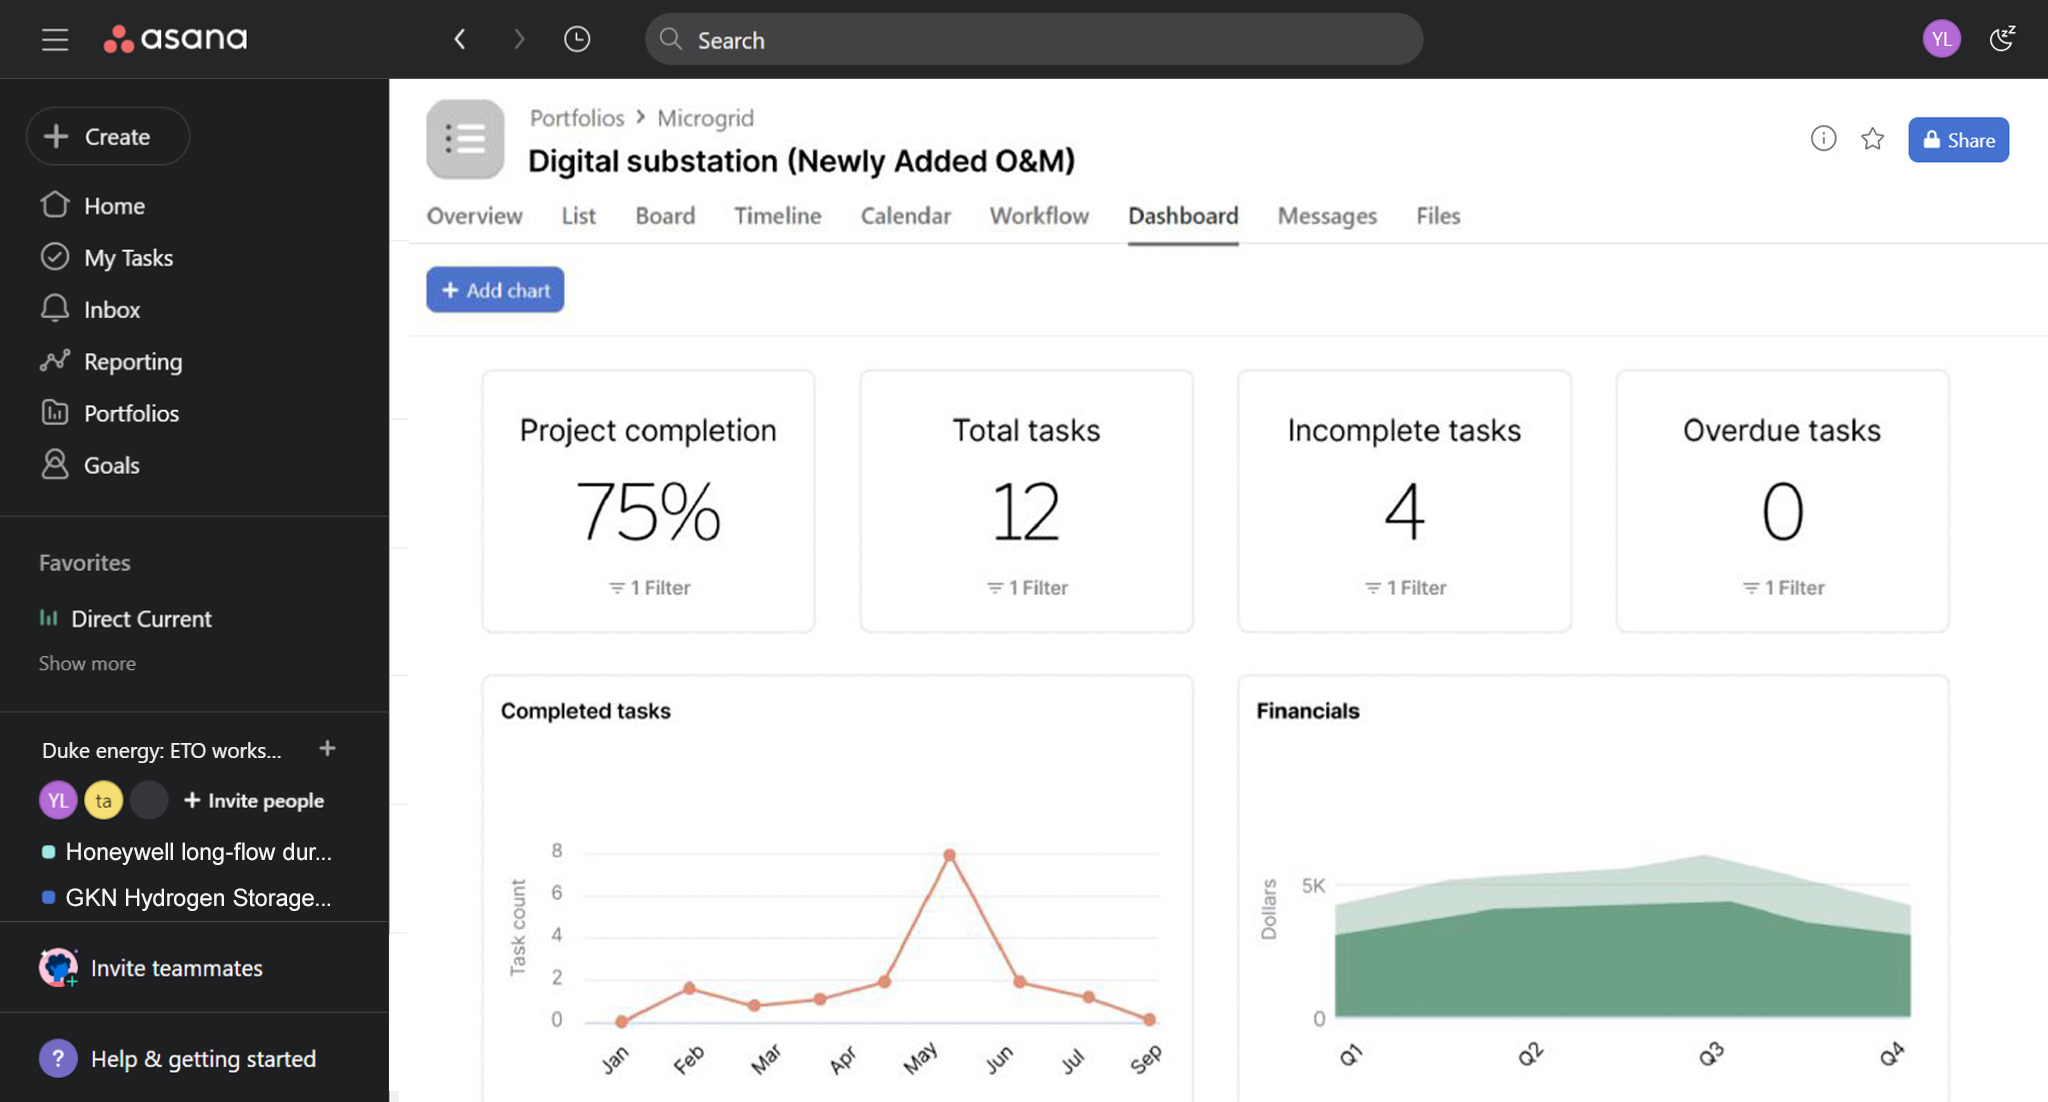
We started with the systems and communication channels ETO already had. In Asana, we explored organizational goals, portfolio status, management reporting, and project-level views so the same underlying work could support different levels of detail. Some of those views moved into use during the engagement.

Prototype values are illustrative and do not represent actual programs or measured outcomes.

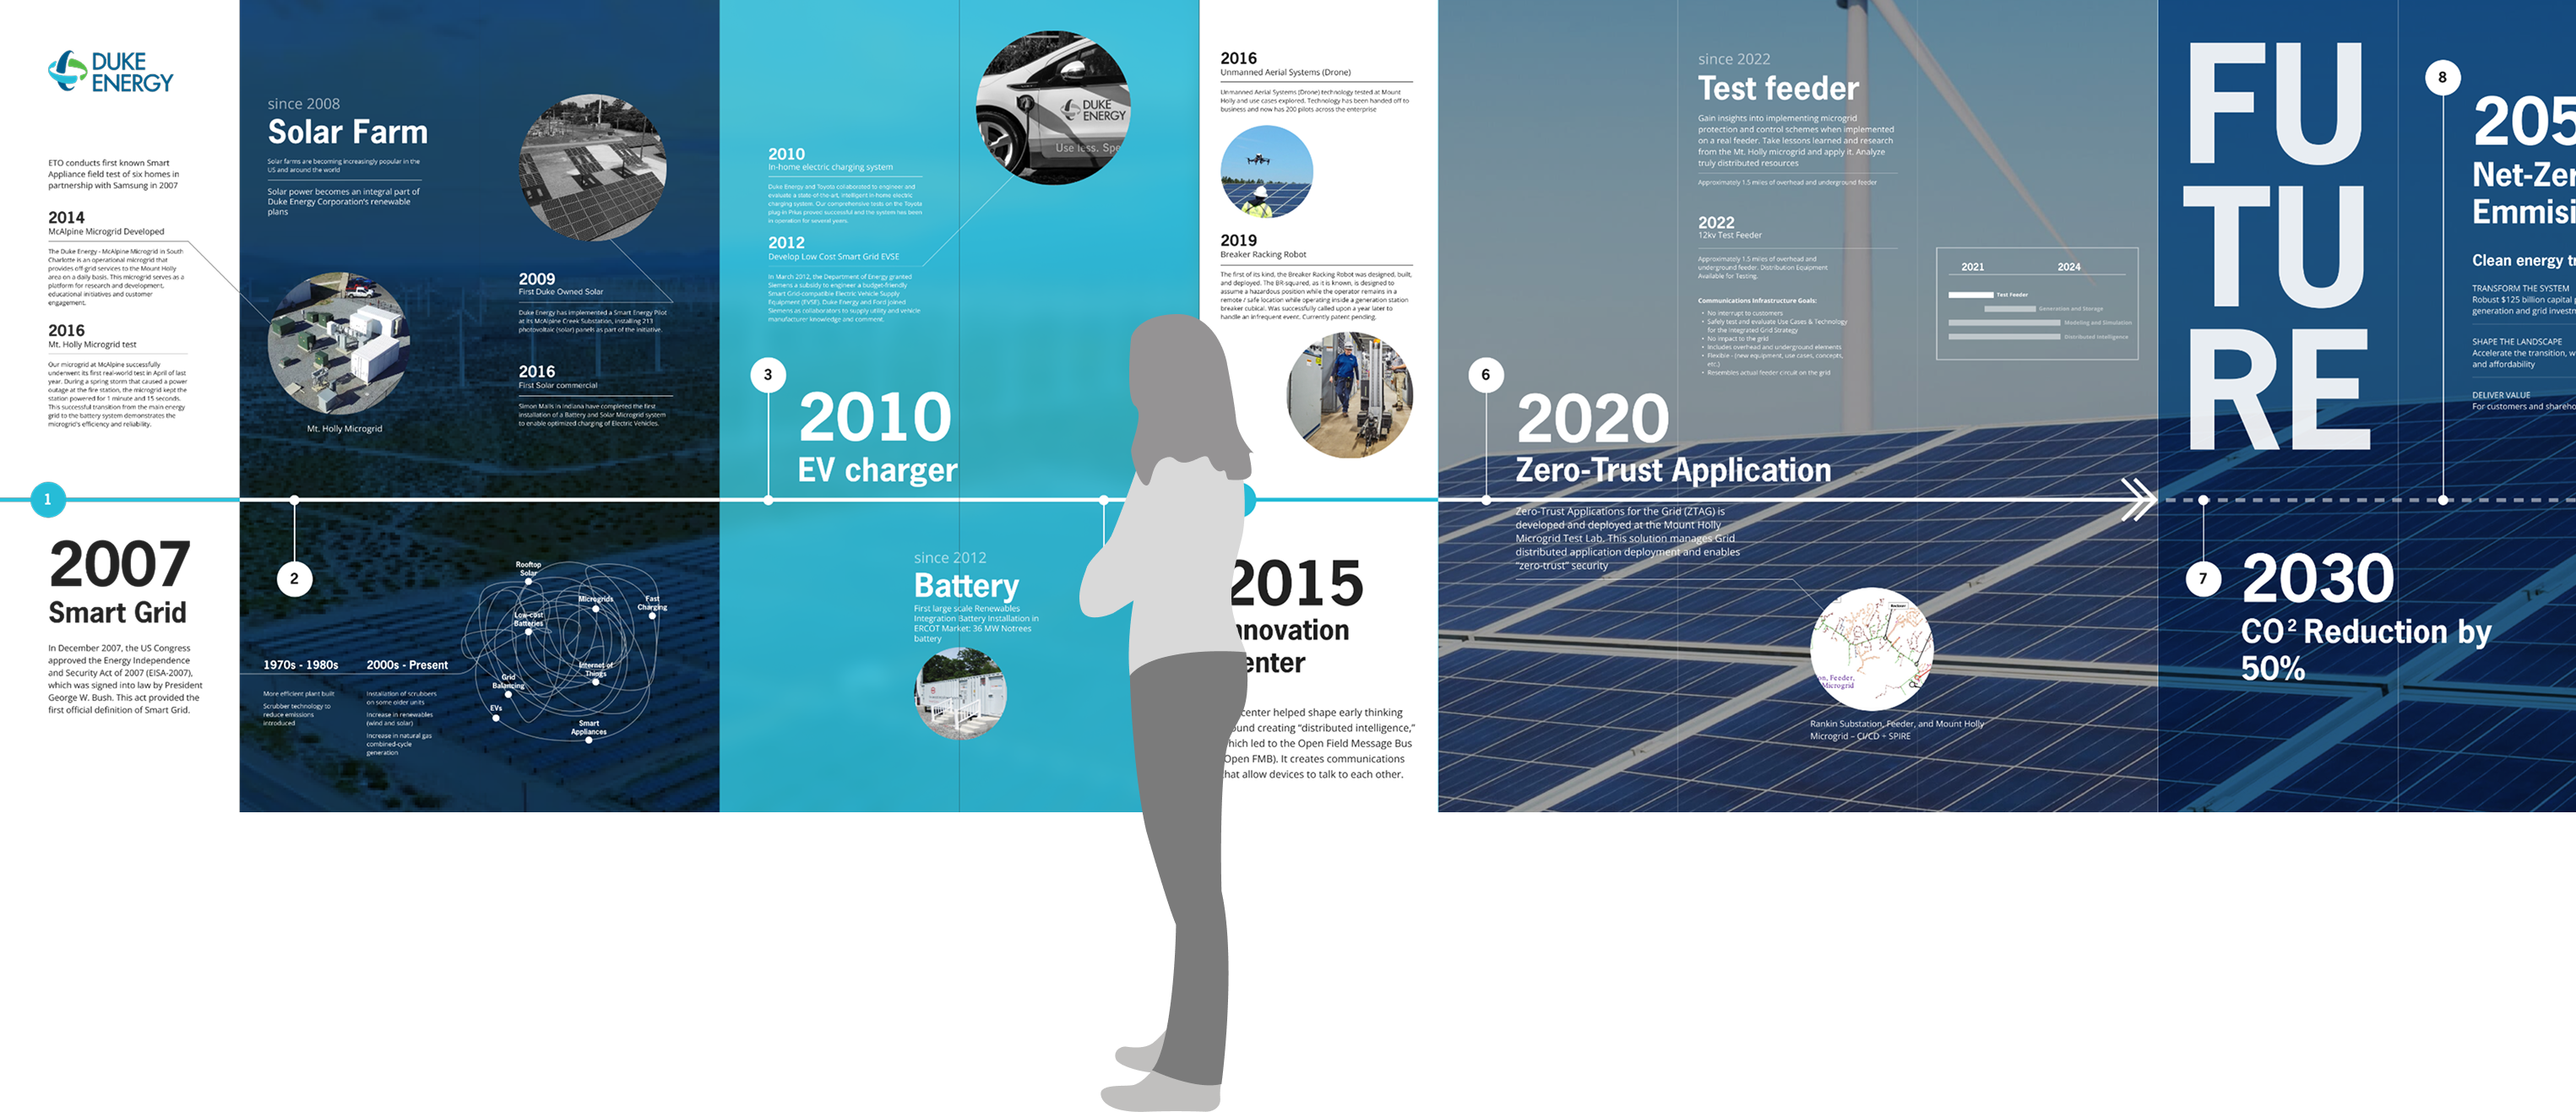
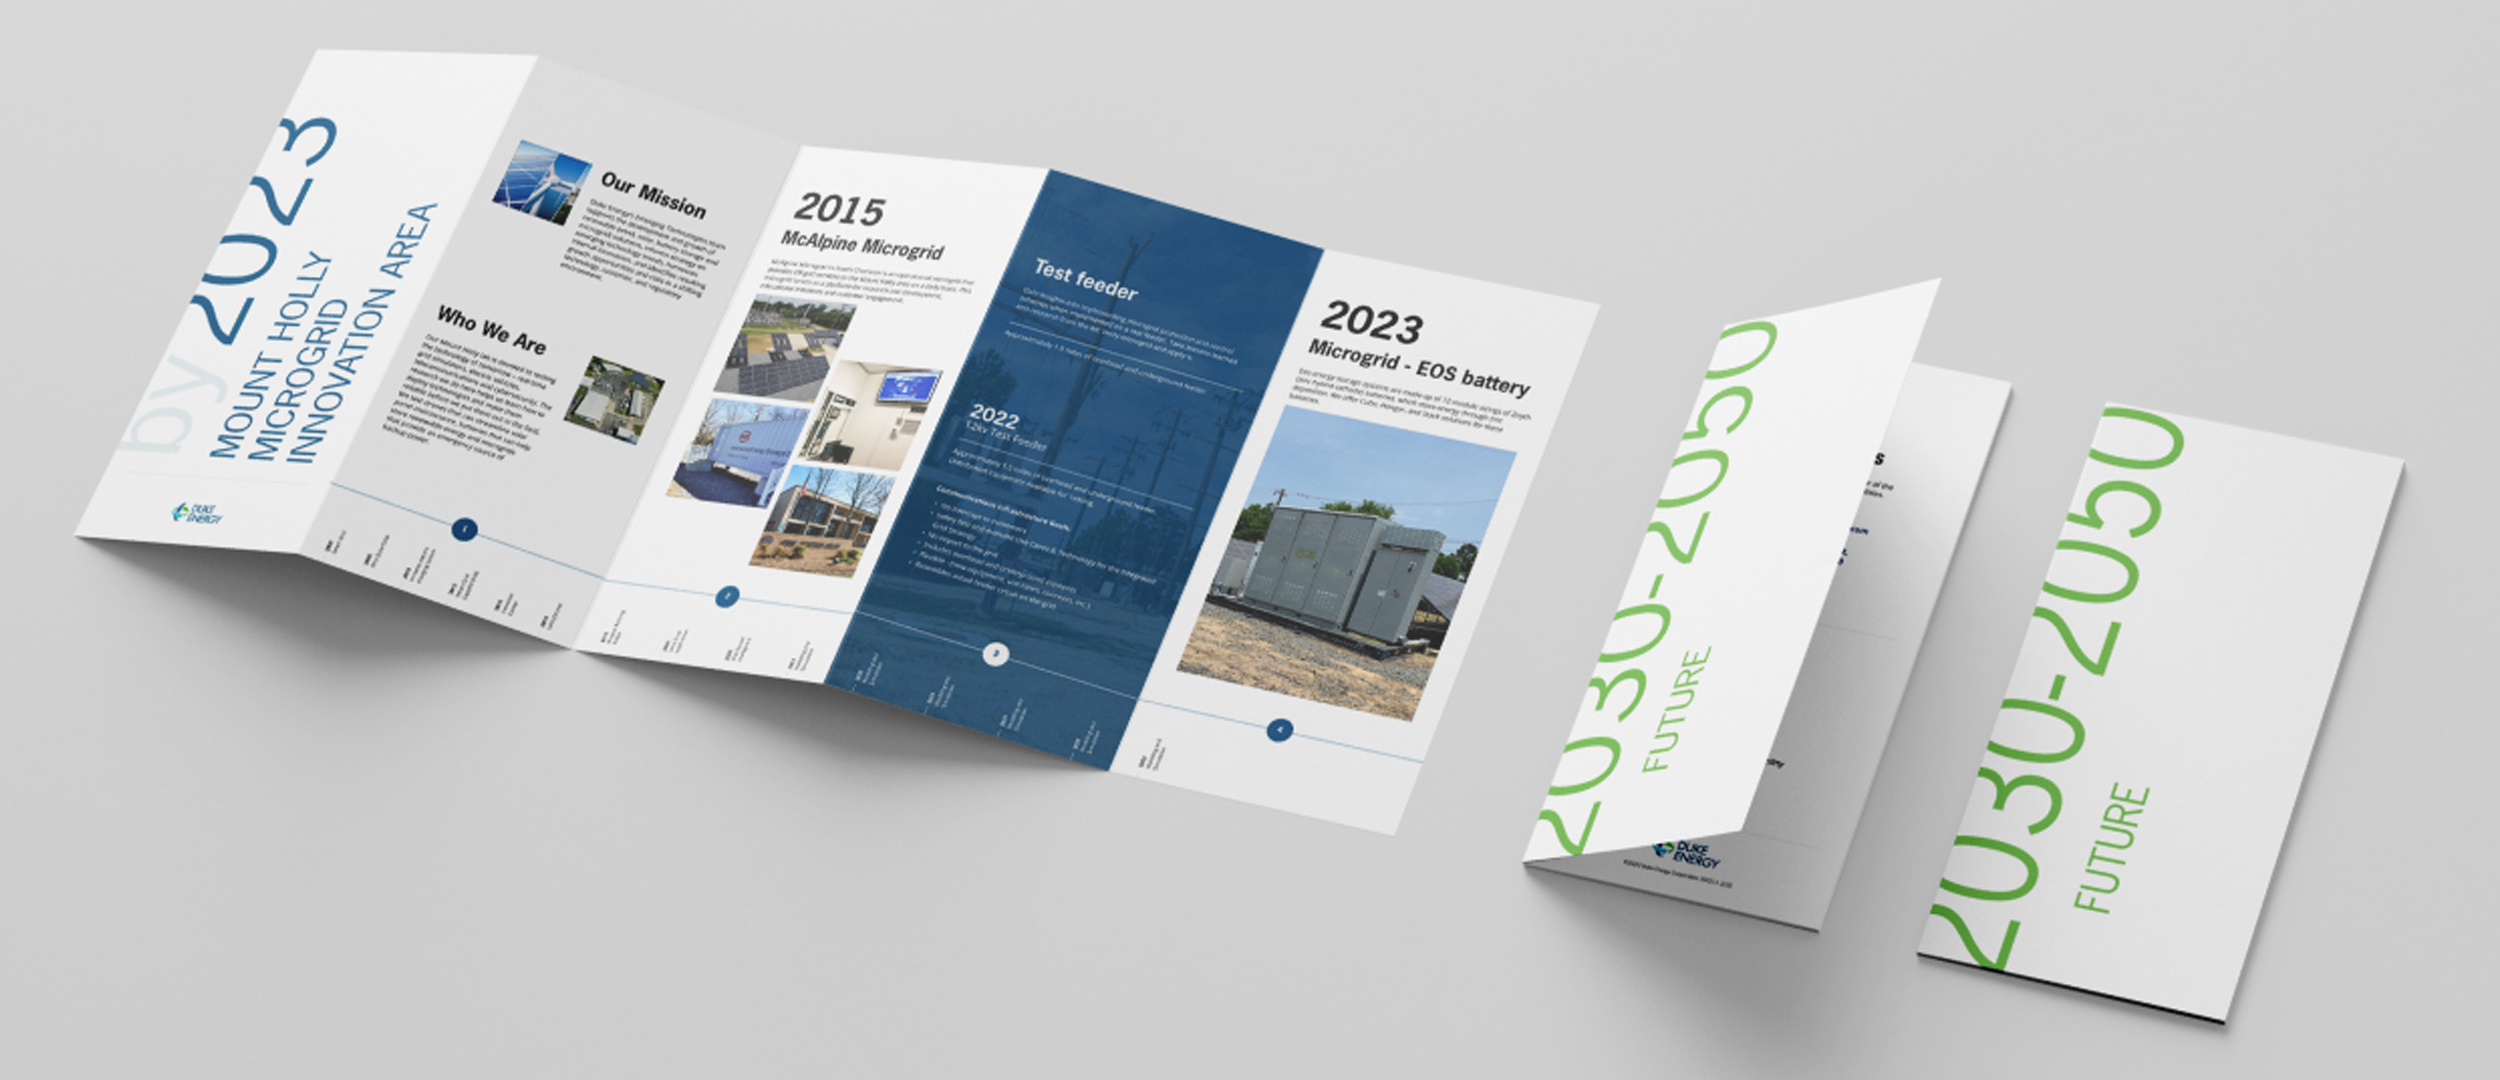
The work extended beyond Asana. We created an improved tour blueprint, proposed a visual timeline showing the progression of ETO’s work, repurposed that story for a brochure, and explored display concepts for goals, projects, lab systems, news, and other information.

That first phase also changed what we thought should happen next. The research exposed workflow and data problems underneath the screens, and I helped turn those findings into the direction and scope for the next phase.

What about the customer?

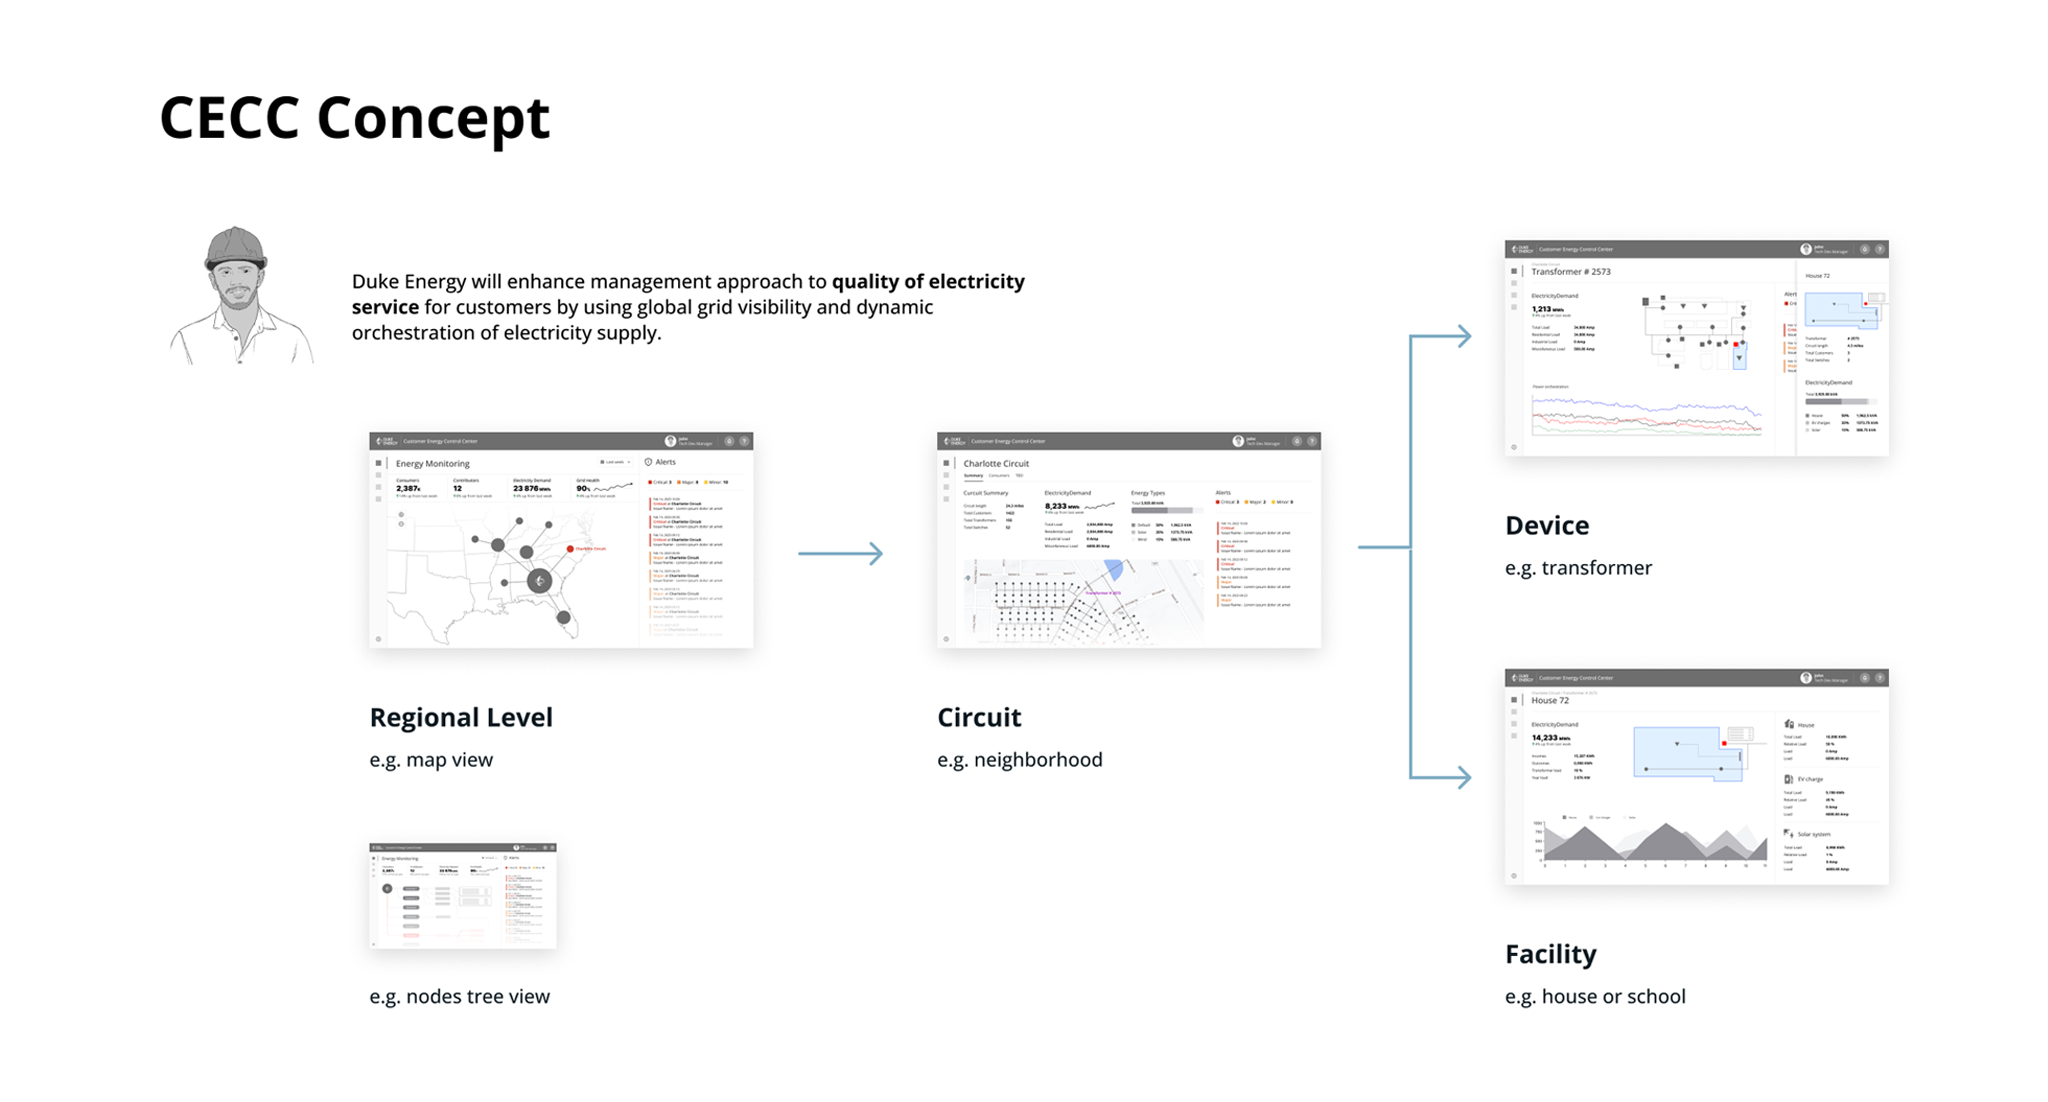
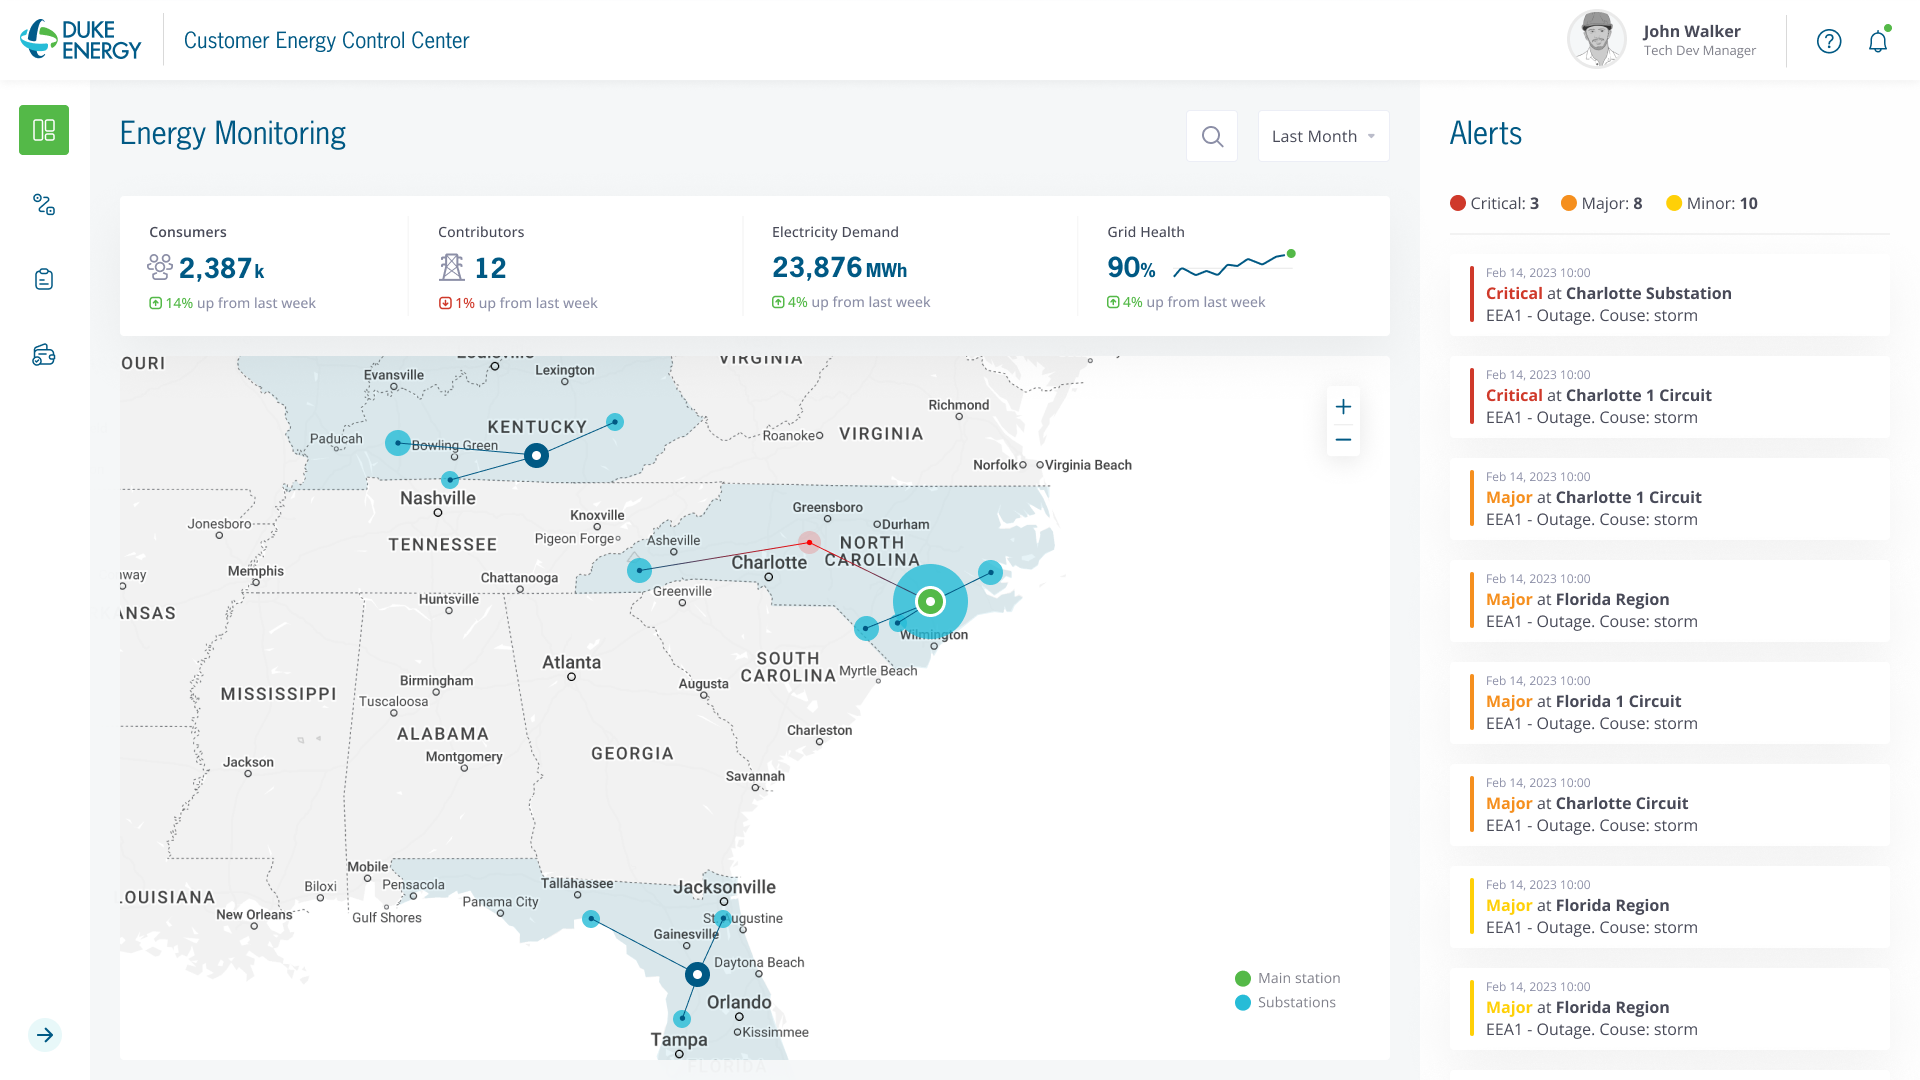
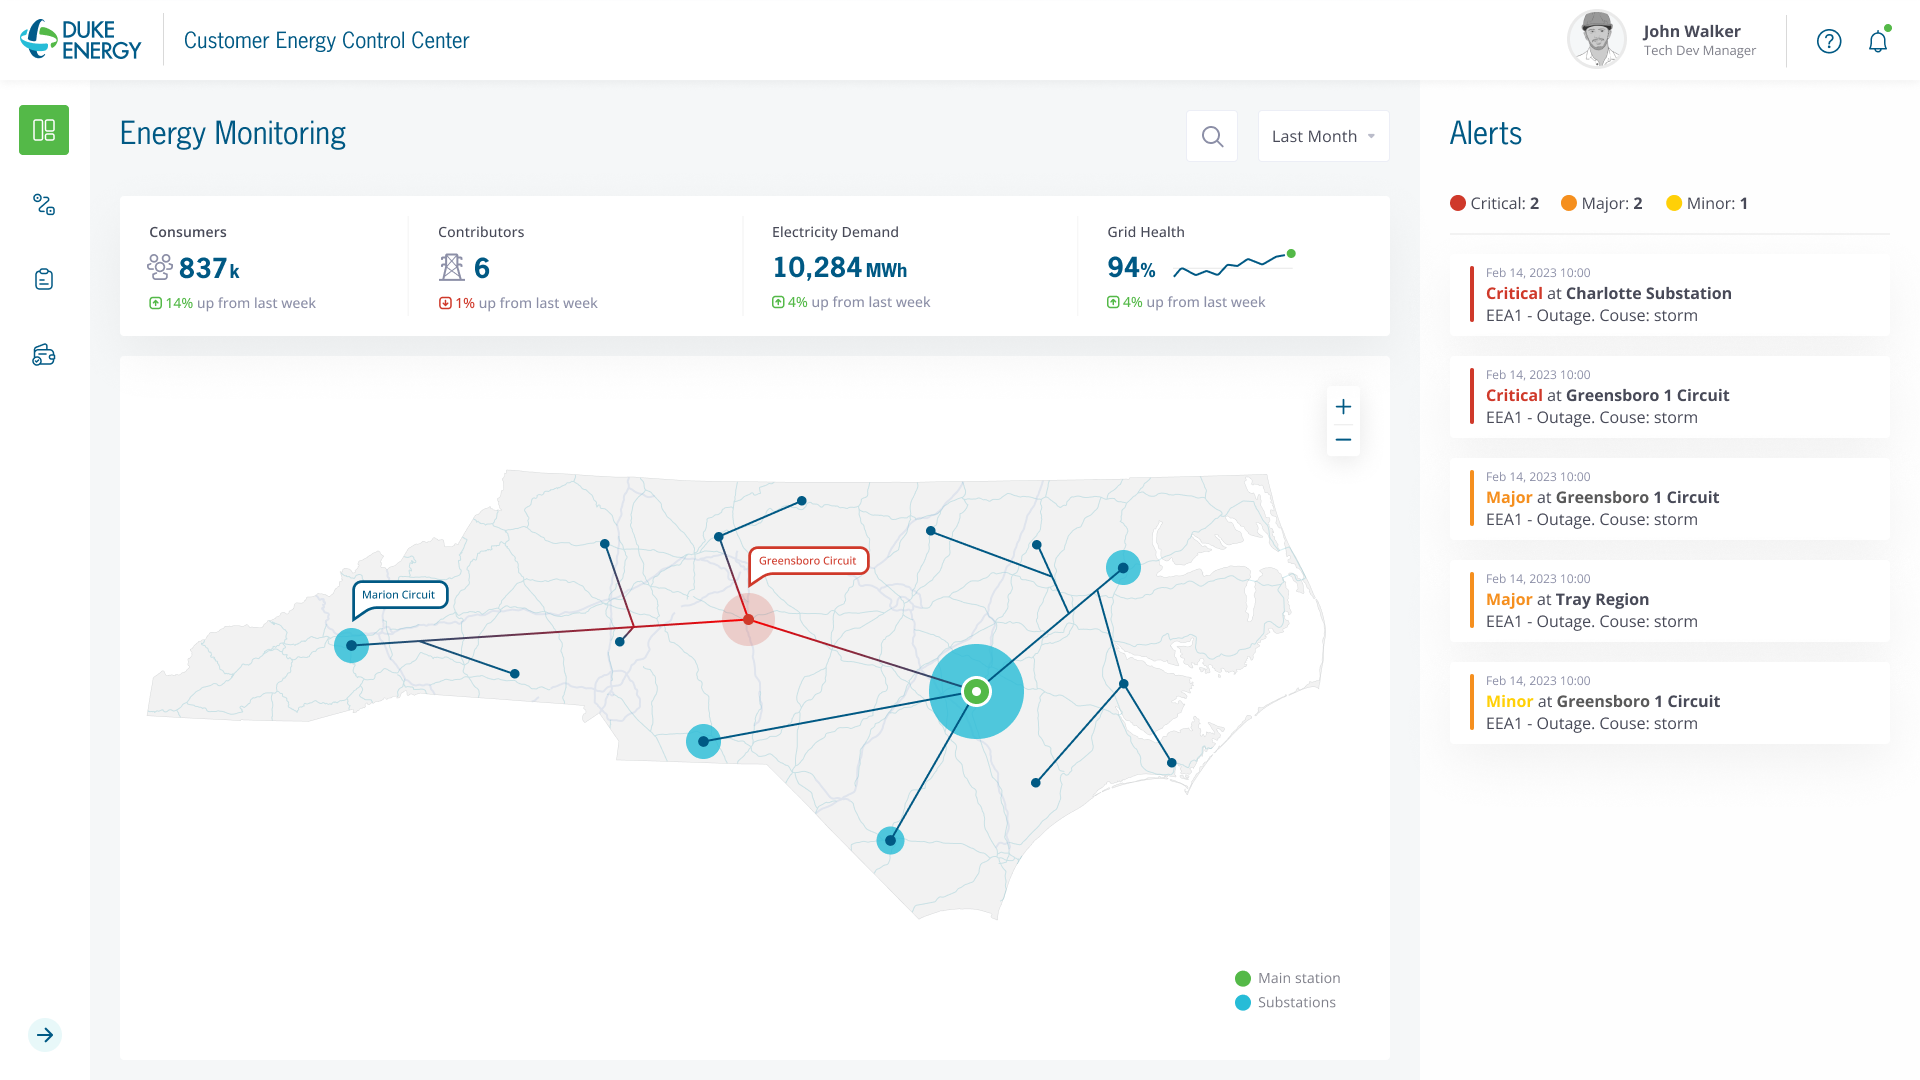
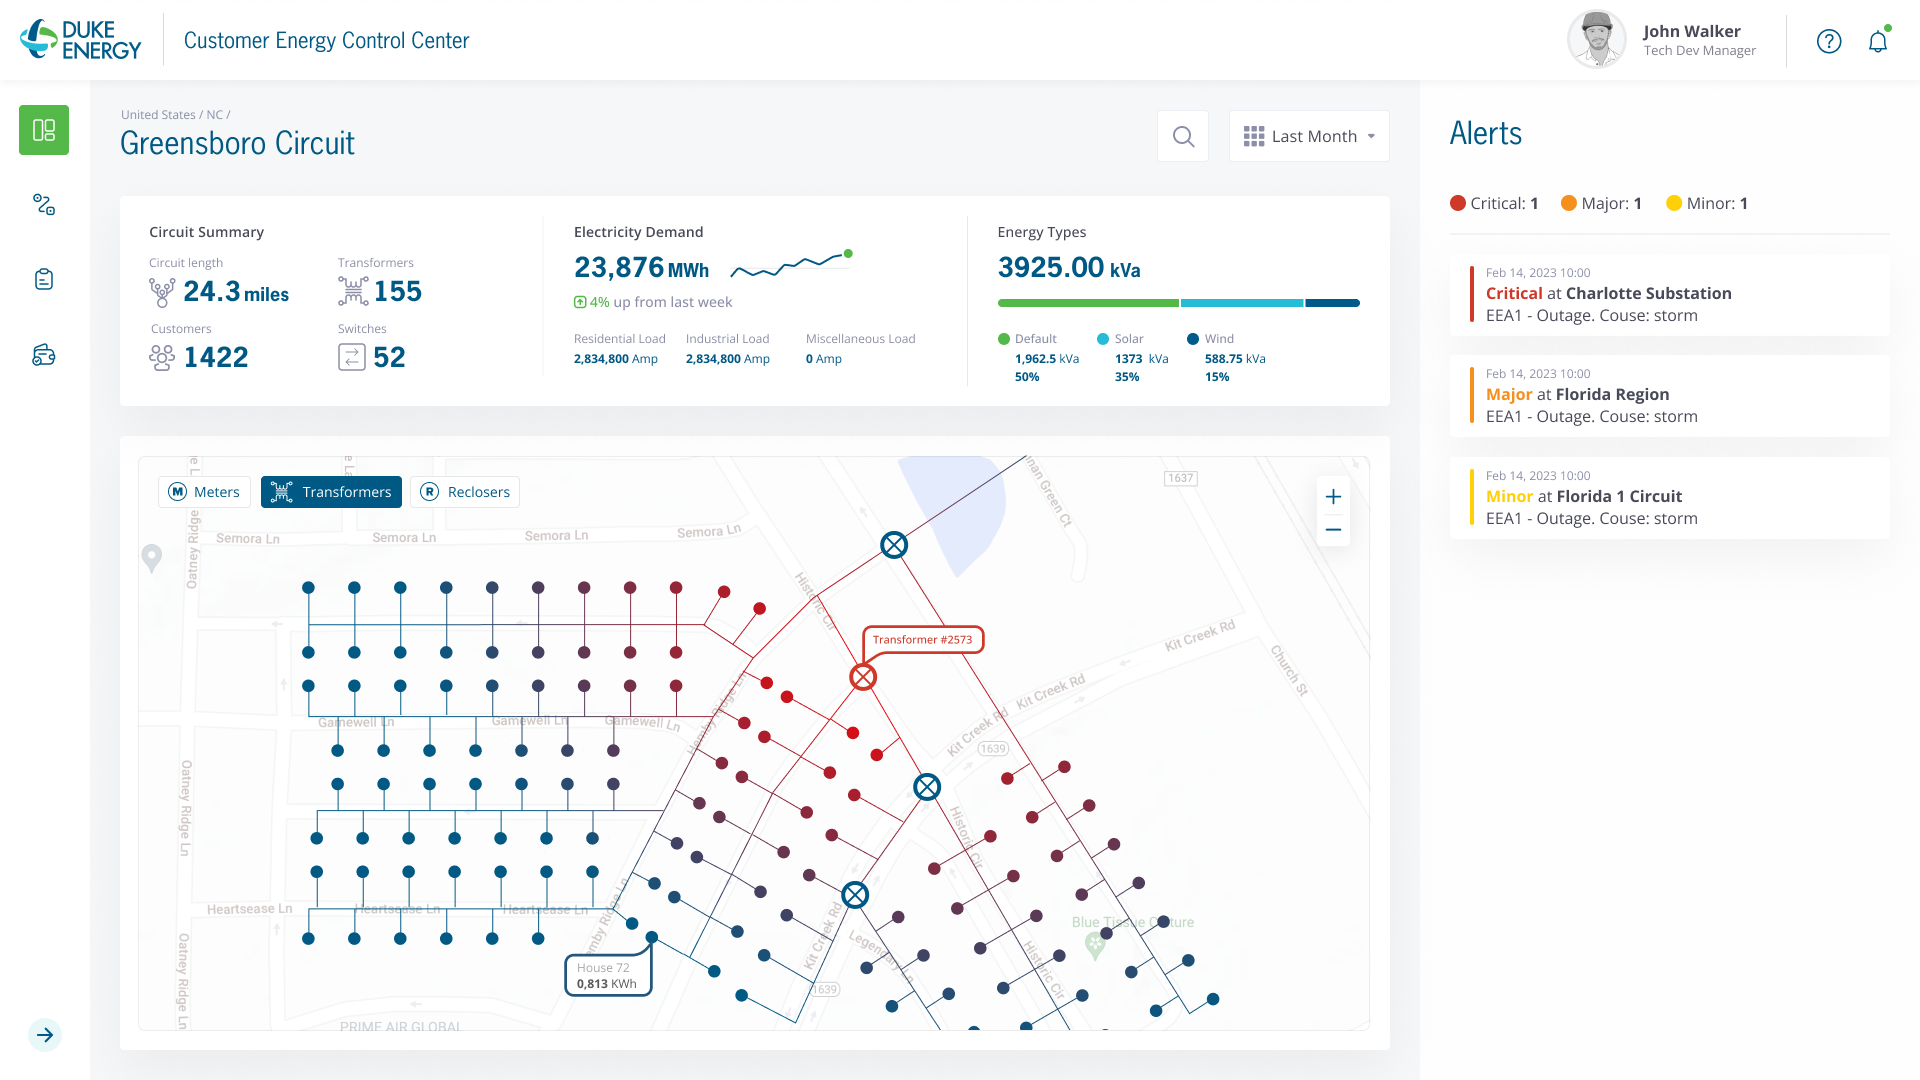
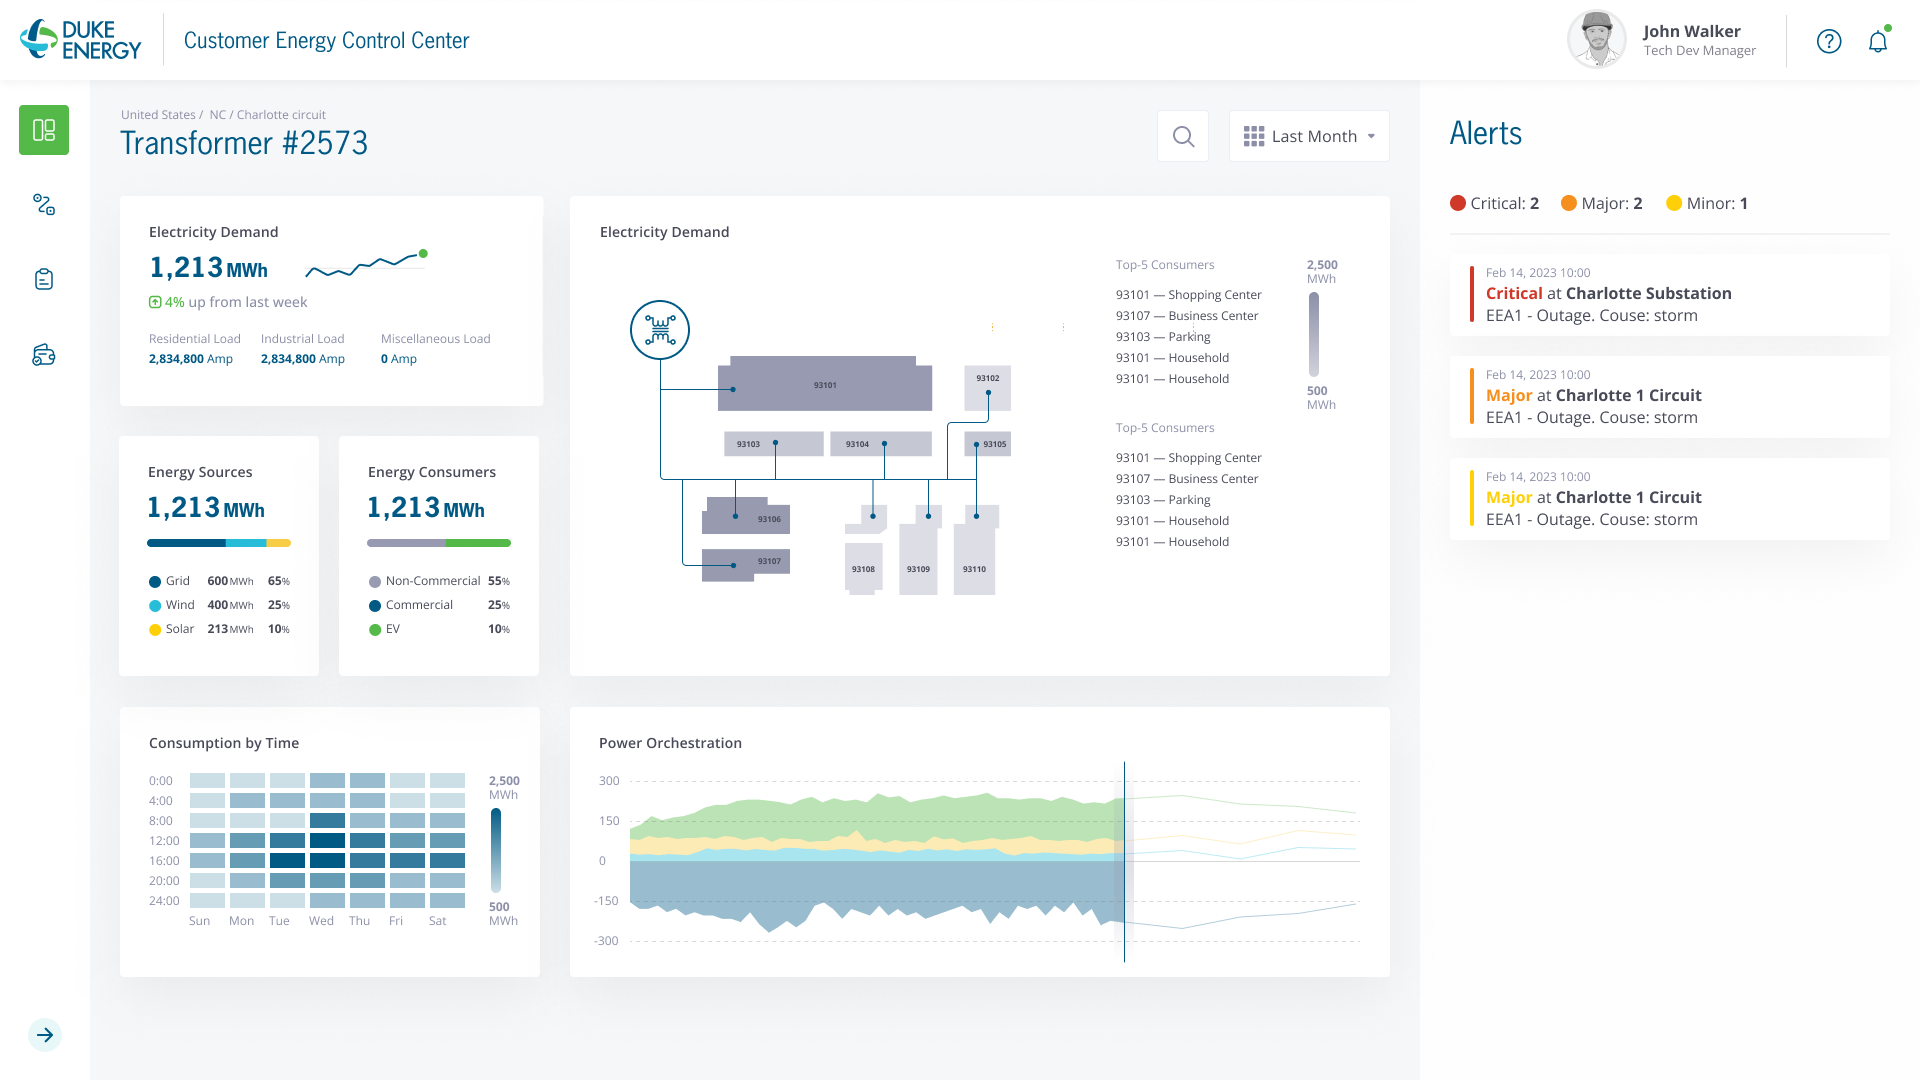
The Customer Energy Control Center (CECC) explored the same information problem from the point of view of a customer. It asked how someone might understand their energy use and system status, where emerging technologies fit into that picture, how Duke was serving them, and how that connected to larger goals and value propositions.

The concept moved from regional context into circuits, devices, and individual facilities. We used it to make a possible future concrete enough for people to react to and discuss.

The interface exposed the system underneath it

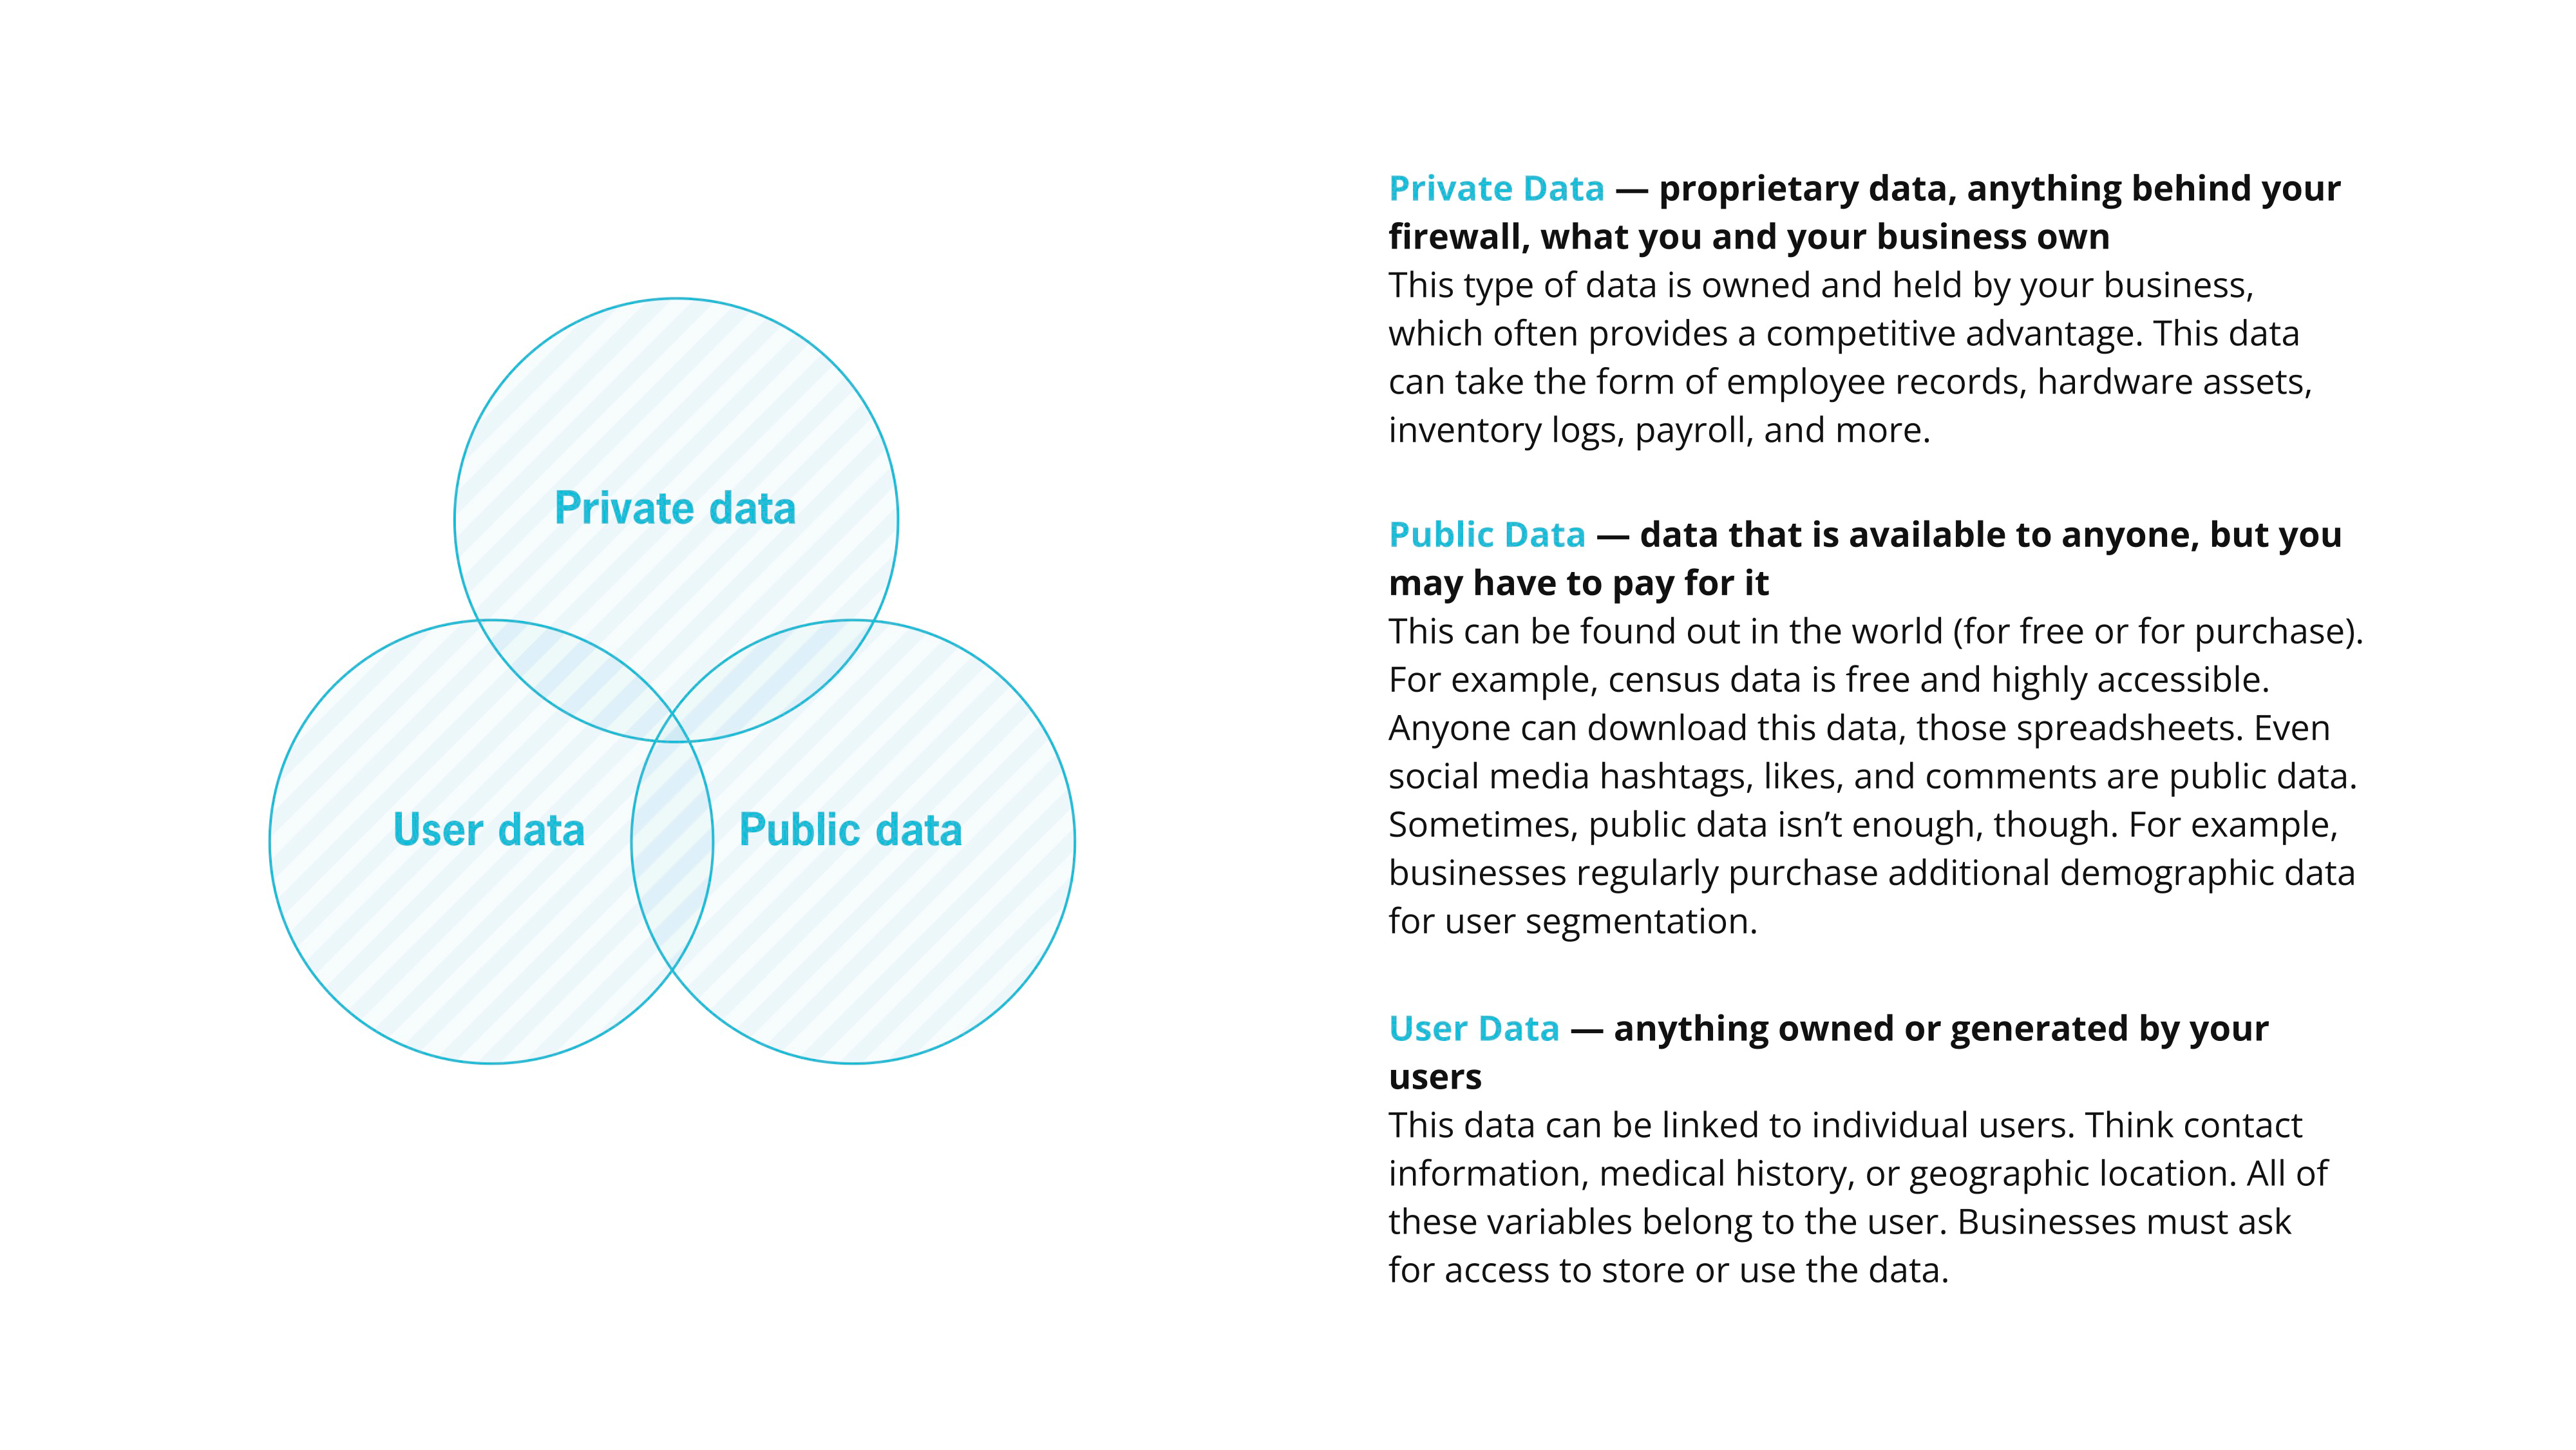
CECC raised the next question: Where would all of that information come from? We mapped available data, the systems holding it, and the gaps between what existed and what future experiences would need. The work was moving from interfaces toward the reporting and data structures underneath them.

Data discovery mapping private, public, and user data, source systems, and gaps for a future control center

The prototype created a data question. We mapped what information existed, where it lived, and what a future experience would still need.

ETO was also working toward more standardized testing, data collection, and automated reporting—part of the larger context for making technical evidence easier to access and use in decisions.

The control-center idea but wider

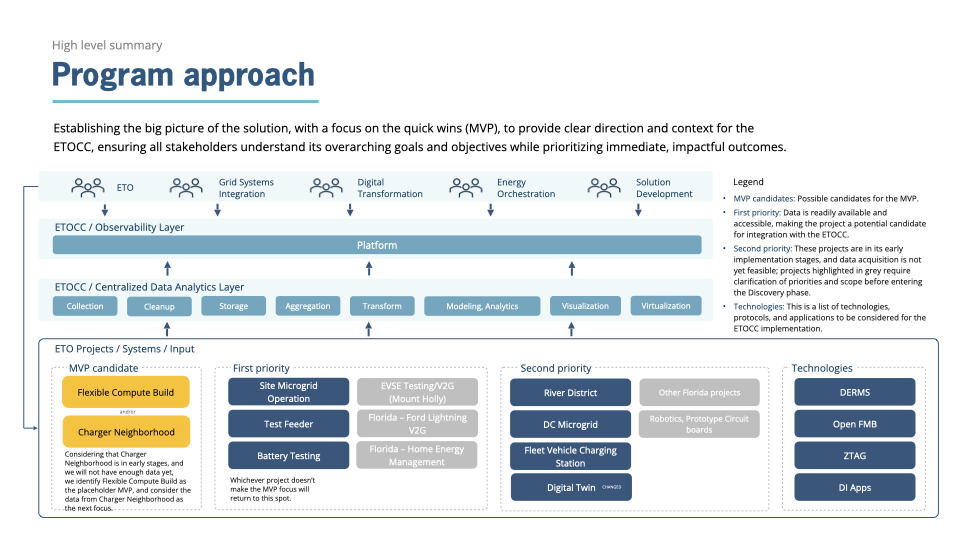
As the storytelling work wrapped, the findings pointed beyond communication artifacts. The next phase turned the control-center idea back toward ETO itself, asking how project information, test results, technical systems, and business context could connect through a common experience.

Research with ETO and adjacent Duke teams surfaced fragmented information, manual reporting, data-access challenges, and sometimes drastically different workflows. The work now required product, design, and technical architecture to move together.

I helped shape what the engagement became next, proposing directions and bringing design, business analysis, technology, and the client team into the same decisions about what to prioritize and validate.

Make the next decision possible

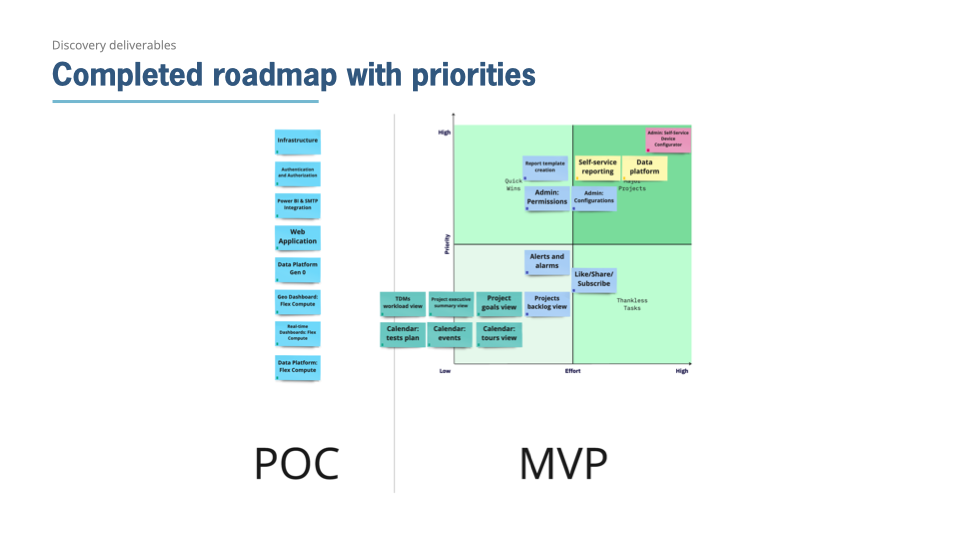
A platform connecting projects, tests, reporting, and technical data could get big fast. A major part of the work became deciding what had to happen first.

We moved from prioritized problems into use cases, flows, an experience prototype, architecture direction, backlog, and a proposed implementation path.

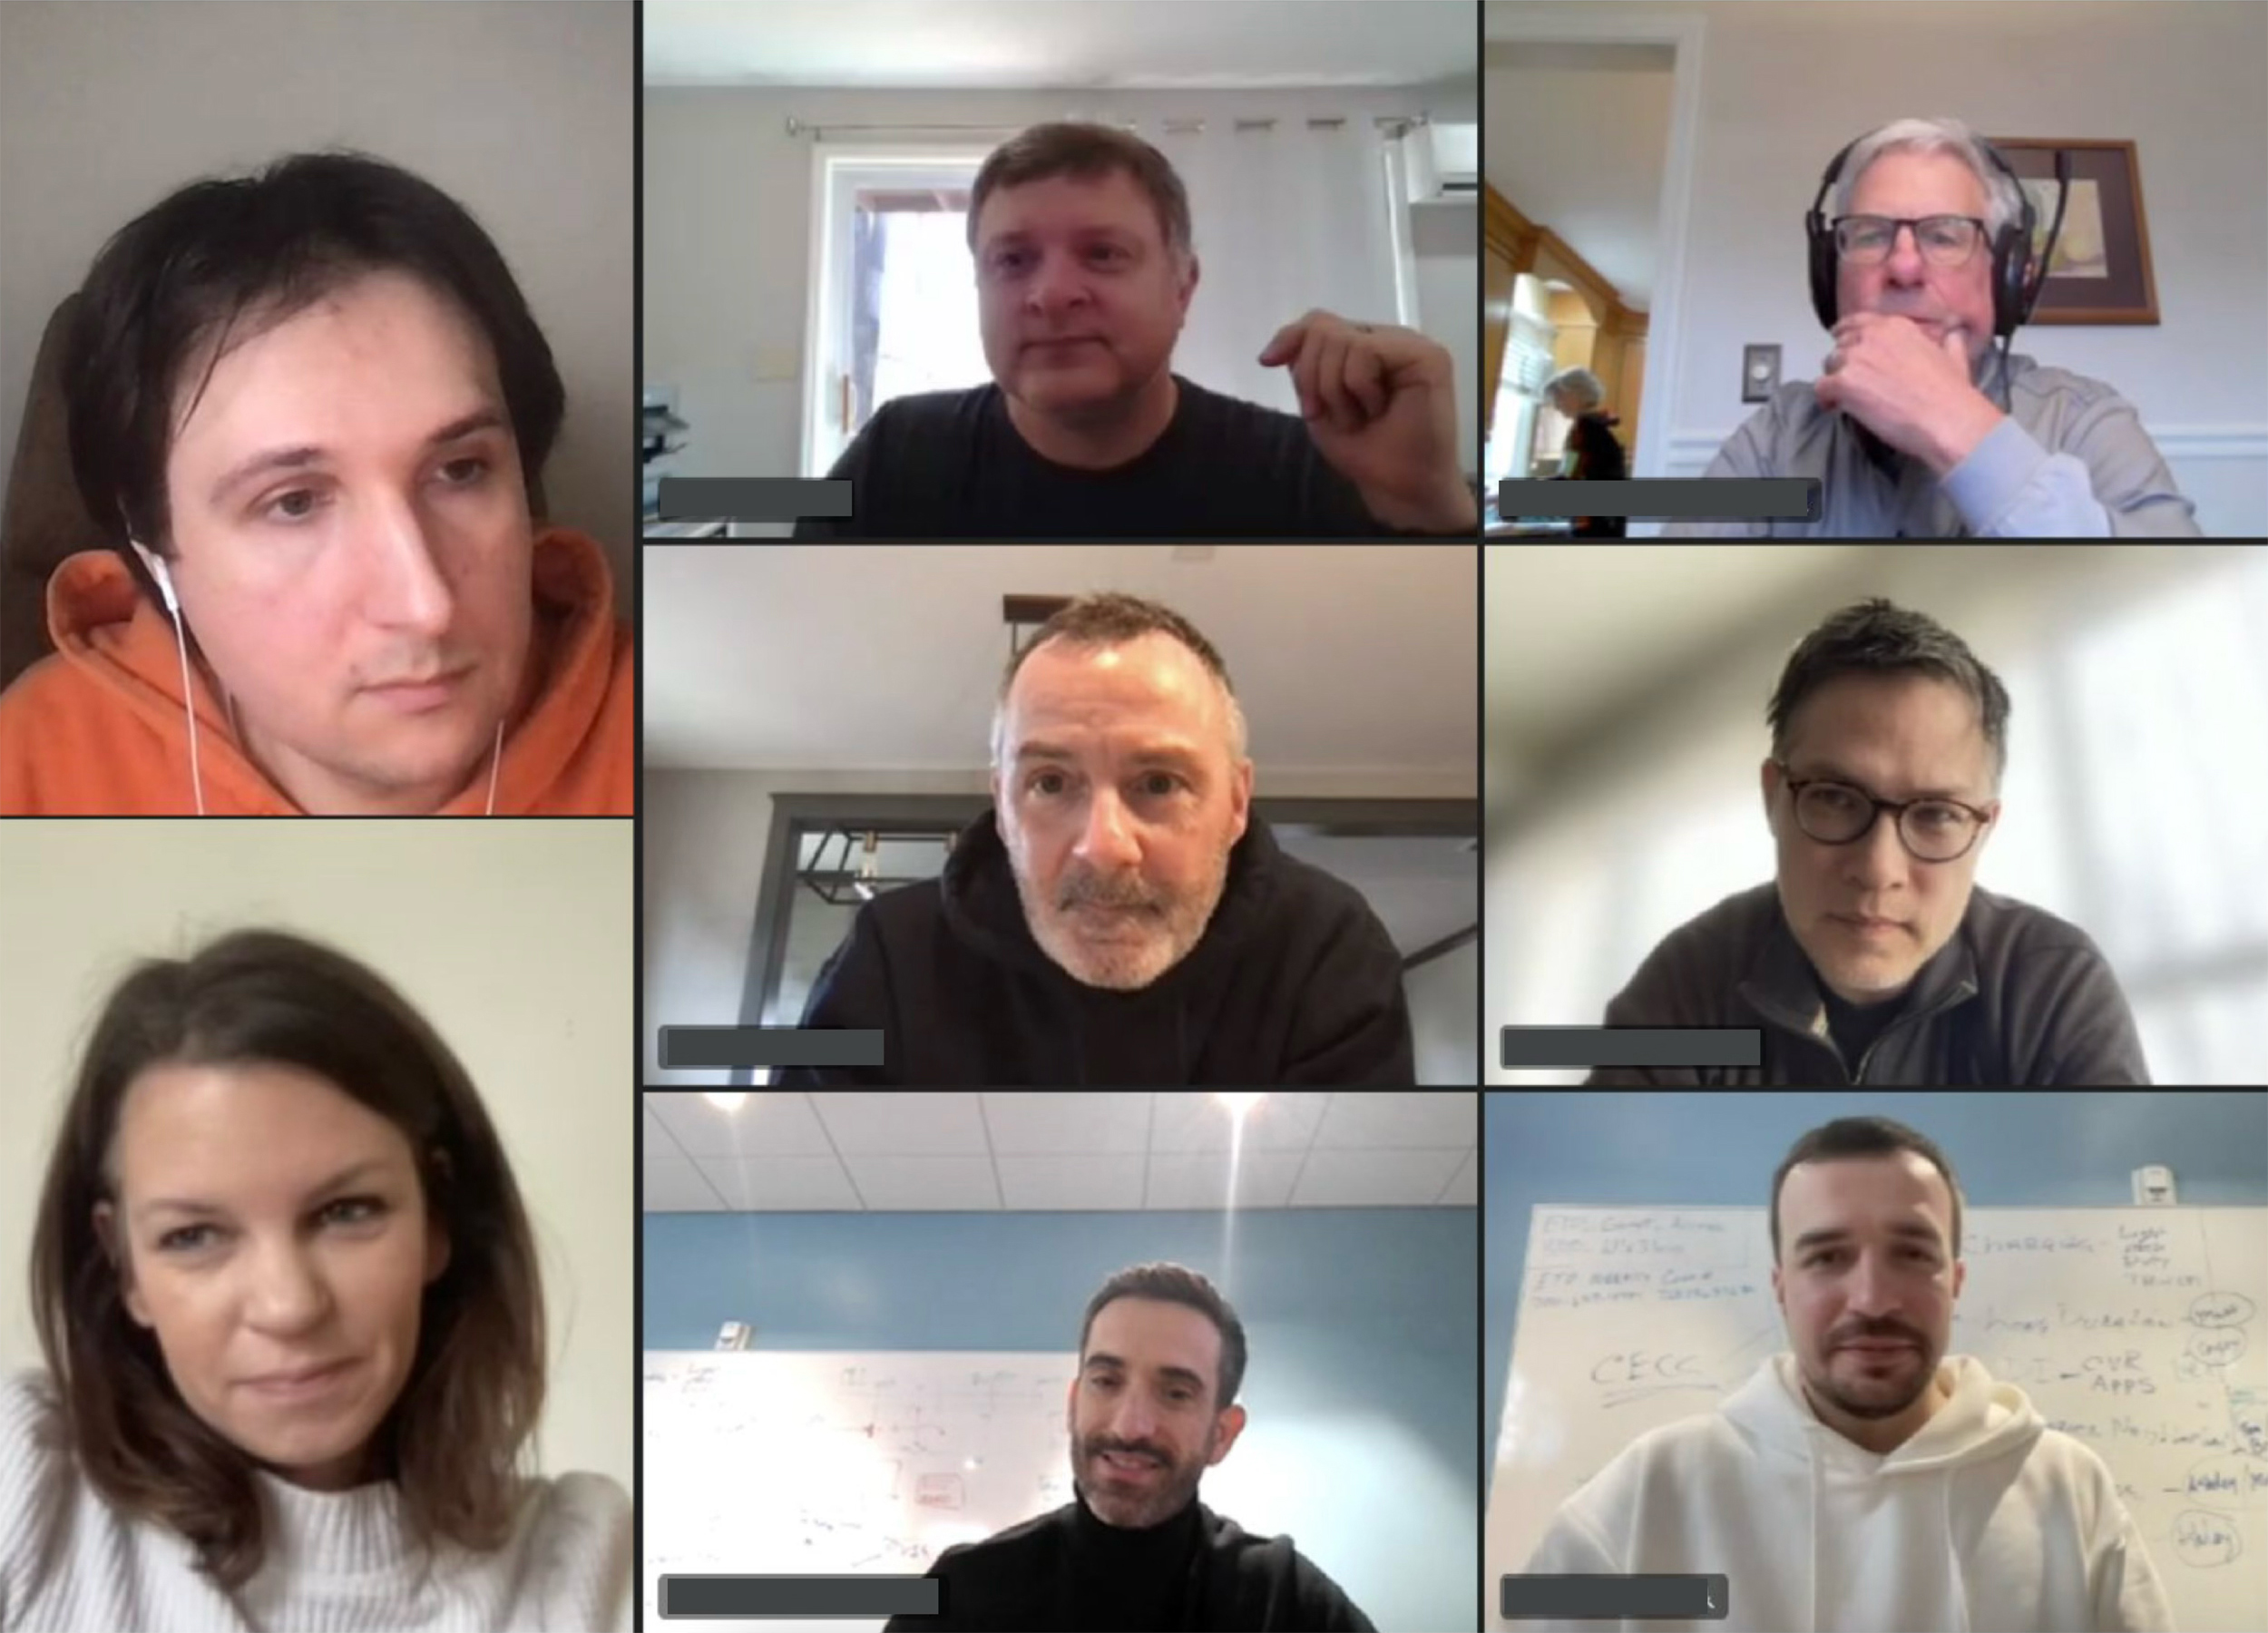
Duke and SoftServe team members in a remote ETOCC working review

Working the decisions together: Recurring reviews brought Duke and SoftServe together around progress, blockers, priorities, and what needed to happen next across design, business analysis, and technology

Those reviews weren’t status meetings. We used them to kill blockers, reset priorities, and change direction when the evidence changed.

What moved

The original monitor and storytelling assignment grew into roughly 18 months of work because each phase exposed another layer of the operating problem.

Some of the Asana views and communication artifacts moved into use. The facility timeline remained a proposal. CECC made a customer-facing future concrete enough to discuss, and ETOCC carried the control-center idea into project information, technical data, product experience, and implementation planning.

By the end of our involvement, the work included a product vision, working experience prototype, prioritized scope, architecture direction, backlog, and a proposed path forward.

Near the middle of the engagement, a senior TDM told us that a project which had been stalled for months received funding after leadership saw it in the context of the broader portfolio, with its status and impact evidence visible alongside the whole slate.

Changing the context around the decision changed what leadership could see.

Duke Energy Emerging Technology Office portfolio and control-center work

The work changed levels

We'd started with four monitors in Bay 3.

Asking the question and following that trail of what belonged on them pulled us through reporting, portfolio visibility, tours, data architecture, and eventually the ETO Control Center. The screens weren’t really the problem, but they were opportunities to allow the problem to become visible.

By the end, the work had moved from deciding what should appear on four screens to deciding how ETO could connect projects, data, and implementation choices across the portfolio.

Each phase gave us evidence for the next decision, and sometimes changed the level of the work entirely.